
As Bitcoin (BTC) sets its sights on reclaiming the $100,000 mark, a trading expert has warned that the cryptocurrency is likely to face further correction later in the year and could potentially crash to $60,000.
In this context, a TradingView analysis shared on January 16 by TradingShot was based on a long-term cycle model that combines halving timelines, moving averages, and Fibonacci time extensions.
The analysis suggested that Bitcoin is approaching a key technical test at the daily 200-day moving average (MA), a level that has historically triggered the second phase of bear cycles. Past behavior indicates that such rejections often lead to extended downside pressure rather than short-lived pullbacks, signaling a shift from a distribution phase into a deeper retracement.
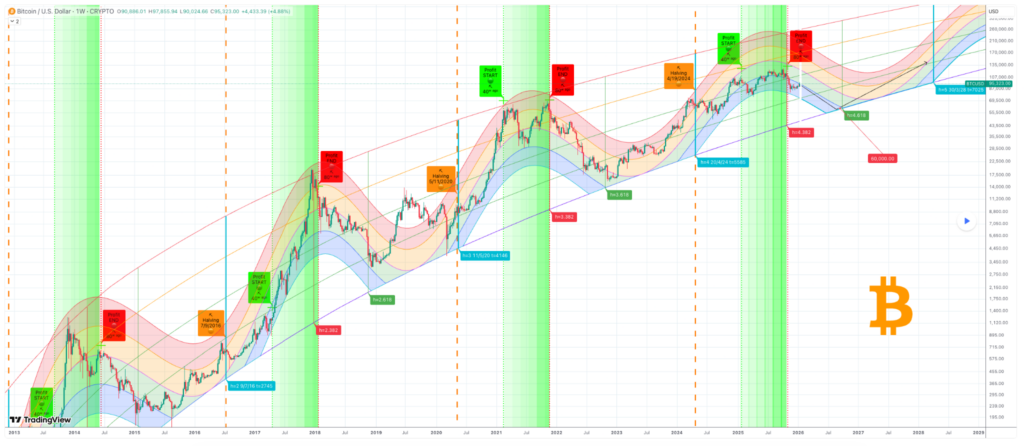
At the same time, the rainbow cycle chart supports this view by aligning price action with halving events and Fibonacci time extensions. The next major time target is the 4.618 Fibonacci extension in the final week of September 2026, a zone that has previously marked cycle lows. At that point, the model projects Bitcoin trading around $60,000, a sharp decline from cycle highs but still consistent with its long-term uptrend.
Notably, the outlook added that this projected bottom would occur well ahead of the next halving, estimated for April 2028, meaning the market would remain far from the next profit-taking phase.
Bitcoin’s failure to hit $150,000
Additionally, Bitcoin’s failure to reach the upper orange rainbow band in the latest bull cycle above $150,000 reinforces the idea of diminishing returns, with each cycle delivering smaller percentage gains.
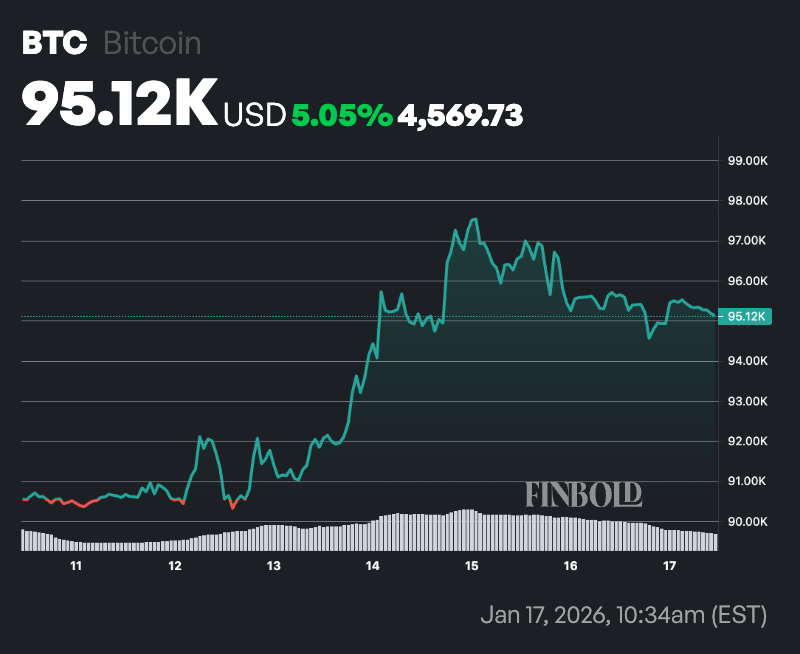
This bearish outlook comes at a time when Bitcoin has attempted to target the $100,000 level before slightly retreating. The asset briefly reignited bullish optimism earlier this week, mainly driven by institutional inflows after breaking out of a prolonged consolidation near $90,000 and rallying to nearly $98,000.
The move raised expectations that traders positioned for sideways or lower prices would be forced to unwind, potentially pushing the cryptocurrency back above the $100,000 mark.
However, the momentum has faded just as quickly. Instead of extending the rally, Bitcoin has reversed course and is now showing signs of weakness, increasing the likelihood of a pullback toward the low-$90,000 range.
Bitcoin price analysis
By press time, Bitcoin was trading at $95,123, down about 0.4% in the past 24 hours, while on the weekly timeframe, the leading digital asset was up more than 5%.
From a moving average perspective, the 50-day SMA at $90,095 remains below the current price, signaling short-term bullish momentum as Bitcoin trades above this level, potentially indicating near-term upward pressure.
In contrast, the 200-day SMA at $105,657 remains above the current price, suggesting longer-term bearish undertones or an ongoing correction from prior highs.
Meanwhile, Bitcoin’s 14-day RSI of 63.30 remains neutral, avoiding overbought territory and implying room for further gains without immediate reversal risks, although it warrants monitoring for shifts in buying strength.