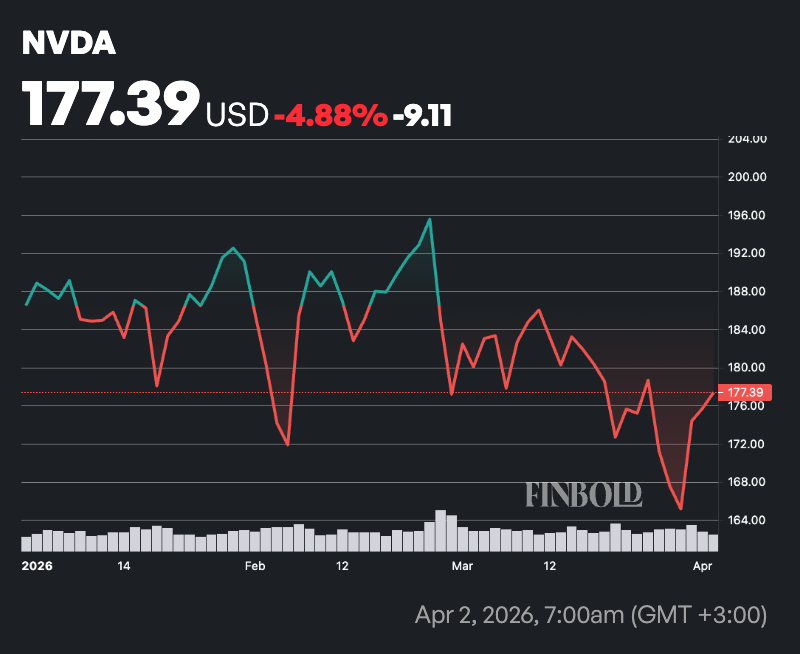
A fresh technical analysis of Nvidia (NASDAQ: NVDA) suggests the stock may be heading toward a significant correction, with projections pointing to a potential drop to $110.
To this end, insights shared by TradingShot in a TradingView post on April 2 highlighted that Nvidia recently tested its weekly 50-period moving average (MA), a key support level that has historically defined the strength of its long-term uptrend.
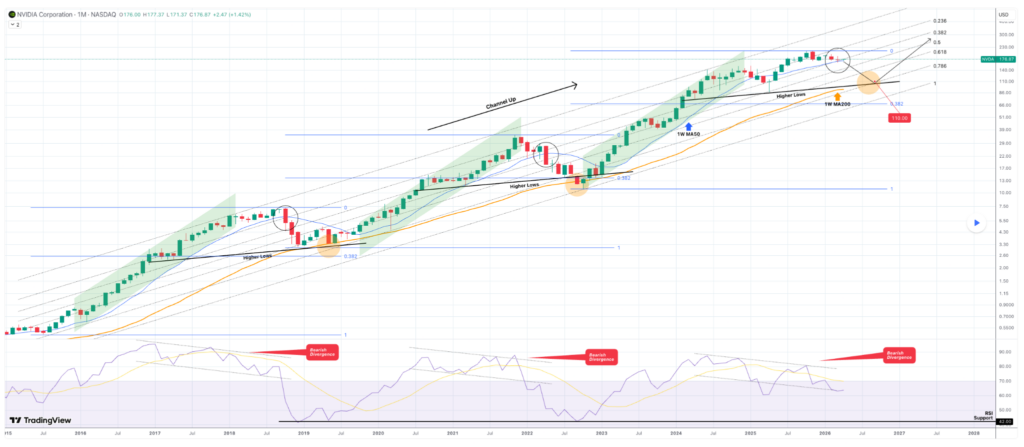
Although the price briefly slipped below this level, it managed to close the monthly candle above it, indicating that the bullish structure has not yet fully broken. However, the chart shows this support is now under pressure.
Within Nvidia’s long-standing upward channel, previous breakdowns below this weekly average have consistently triggered deeper declines toward the rising “higher lows” trendline.
These pullbacks have typically unfolded during broader bearish phases, where price action gravitates toward the 200-week moving average, a level that has historically acted as a cyclical bottom.
The outlook pointed to repeated bearish divergence on the monthly RSI, a pattern that has preceded every major downturn in Nvidia’s 11-year channel. This signals weakening momentum despite elevated prices, reinforcing the case for a correction.
Nvidia stock $110 target
TradingShot’s downside target aligns with the higher lows trendline near $110, a key long-term support zone. Although the 0.382 Fibonacci level sits below this area in the current cycle, past bear phases have bottomed around it, supporting $110 as a minimum target.
Chart timing suggests the move could unfold by early September 2026 if the stock breaks below the weekly 50 moving average, a shift that would likely mark a new bearish leg within the broader uptrend.
Still, the monthly RSI near 42 remains a critical long-term support signal, having marked bottoms in 2018 and 2022. A return to this level could indicate the correction is ending and accumulation is beginning.
A drop to $110 would imply a correction of nearly 40% from the stock’s last trading value of $177.
Nvidia stock fundamentals
Despite the technical warnings, Nvidia continues to dominate the AI semiconductor field. For instance, developments centered on the Vera Rubin platform, unveiled at GTC 2026, are widely viewed as the next major driver of margin sustainability and competitive moat expansion.
The full-stack architecture, featuring the Rubin GPU, new Vera CPU, and integrated rack-scale systems, targets significant gains in agentic AI and inference workloads, promising up to 5x better inference performance and major efficiency improvements over Blackwell. Production is already underway, with hyperscalers preparing deployments later in 2026.
Additional tailwinds include HBM supply chain diversification and selective progress in the China market, both of which help mitigate execution risks and support long-term visibility.
Analysts largely view the current consolidation in Nvidia shares as a healthy pause, potentially setting the stage for upside as Rubin ramps and the May 20, 2026, first-quarter earnings report provides fresh execution updates.