A trading expert has warned that technical indicators are pointing to a further correction in the benchmark S&P 500 index in the coming months.
Notably, the index has shown volatility across 2026, largely driven by uncertainties stemming from geopolitical tensions between the United States and Iran. However, with a fragile ceasefire in place, there are expectations that the index could rally further.
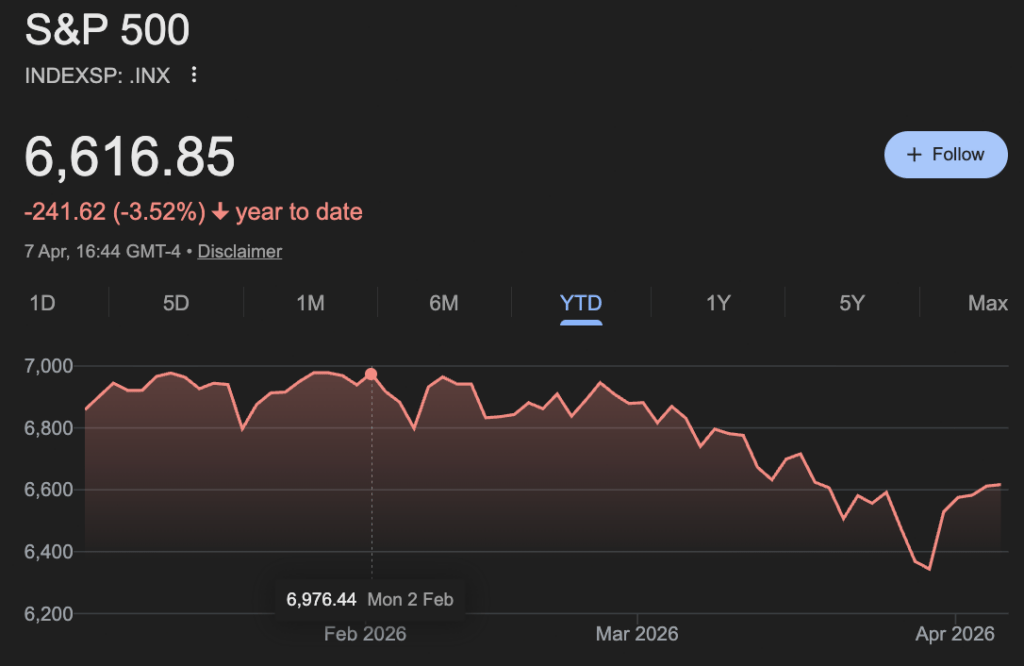
Amid this uncertainty, the S&P 500 has traded above 6,500 for the better part of the year, with several projections indicating it could reach 7,000 by year-end. As of press time, the index was trading at 6,616, down 3.5% year-to-date.
S&P 500 projection
However, in a TradingView post on April 7, trading expert TradingShot pointed out that the index is facing bearish sentiment as it approaches a one-day death cross. This signal occurs when the 50-day moving average (MA) crosses below the 200-day moving average.
Insights from the analyst indicate that similar setups over the past eight years have consistently led to notable corrections.
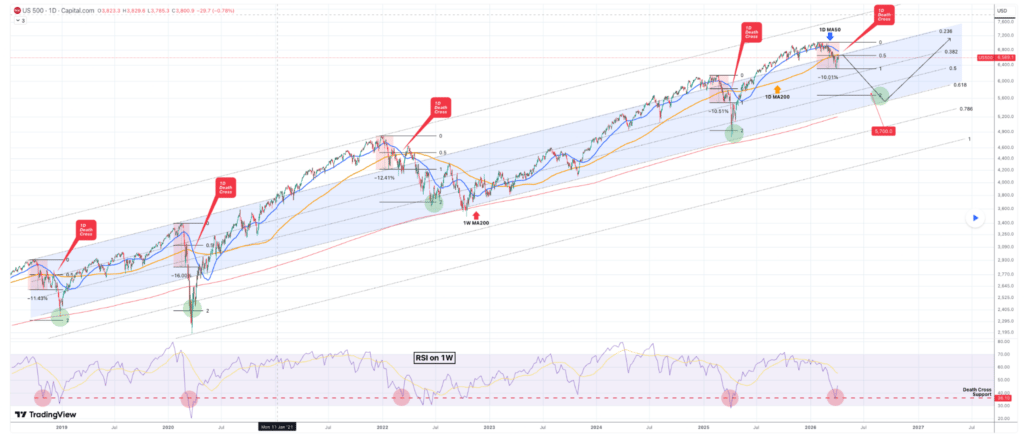
These include both rapid downturns, such as the 2020 pandemic-driven crash, and more prolonged bear phases like those seen in 2018 and 2022.
In each case, the market followed a recognizable pattern where an initial decline, a rebound toward the 0.5 Fibonacci retracement level, and then a renewed sell-off toward deeper extension levels.
According to TradingShot, the current setup mirrors past fractal patterns, having already fallen about 10% and rebounded to the mid-range Fibonacci level. However, this recovery may be losing steam as price action begins to roll over near the top of a long-term ascending channel.
At the same time, the weekly relative strength index is trending lower toward 36, a level that has historically aligned with major bottoms, but only after significant declines. Previous cycles also show pullbacks often extend to the 200-week moving average before stabilizing.
Taken together, these signals point to a fresh bearish leg, with a minimum downside target around 5,700 and potential for a deeper drop toward 5,500 if long-term support is fully tested. The timeline suggests this correction could peak in the fourth quarter of 2026 before stabilizing.
S&P 500 fundamentals
Despite the soft start to 2026, underlying fundamentals remain supportive for the index.
For instance, first-quarter 2026 earnings for S&P 500 companies are projected to grow about 13.2% year over year, marking a sixth straight quarter of double-digit gains, while revenue is expected to rise around 9.7% amid resilient corporate performance.
On the other hand, Wall Street remains broadly optimistic for the rest of the year, with consensus year-end targets in the 7,100 to 7,800 range, and more bullish forecasts approaching 8,000, supported by earnings momentum, AI-driven productivity gains, and expectations of economic resilience.