
A trading expert has outlined a possible bearish trajectory for XRP, projecting that the digital asset could decline toward $0.80 in the coming months.
In a TradingView post on March 20, analysis by TradingShot was based on a technical assessment of XRP’s weekly chart, which shows the asset entered a sustained downtrend after being rejected at its 50-week moving average (MA) just above $2.5.
That rejection marked the beginning of a persistent decline, with price action continuing to weaken in the months that followed.
XRP attempted a rebound from the 200-week moving average near $1.05 but failed to reclaim the 100-week moving average around $1.30, reinforcing the broader bearish trend.
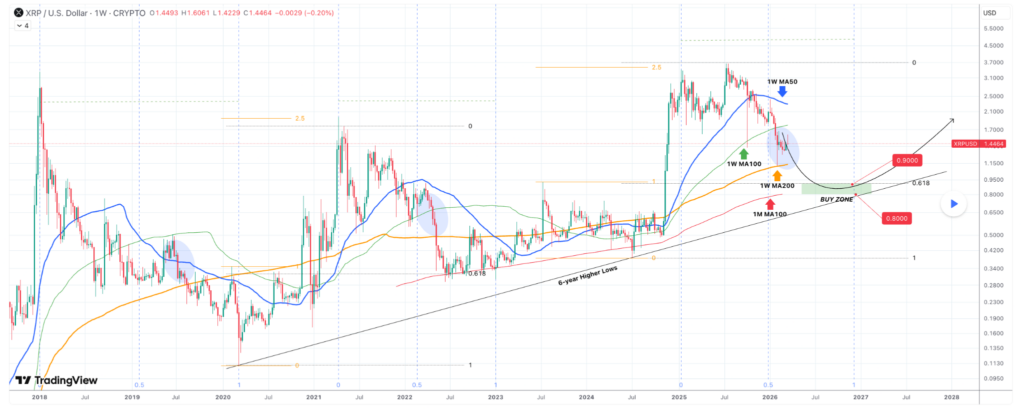
At the same time, TradingShot’s outlook noted that the current cycle mirrors downturns in 2019 and 2022, where similar patterns emerged past the midpoint and led to final capitulation. Time-based Fibonacci levels suggest XRP is now in a comparable late-stage phase.
A break below the 200-week moving average near $1.05 could trigger the next leg lower, with price likely heading toward the 100-month moving average around $0.85, a key historical support level. Further support comes from a six-year ascending trendline near $0.80, reinforcing a strong potential bottom zone.
XRP’s next price target
Together, these signals point to an accumulation range between $0.90 and $0.80, with the upper level aligned to the 0.618 Fibonacci retracement and the lower bound supported by long-term structure.
The chart suggests this zone could be reached by mid-December 2026, marking a potential cycle bottom for XRP.
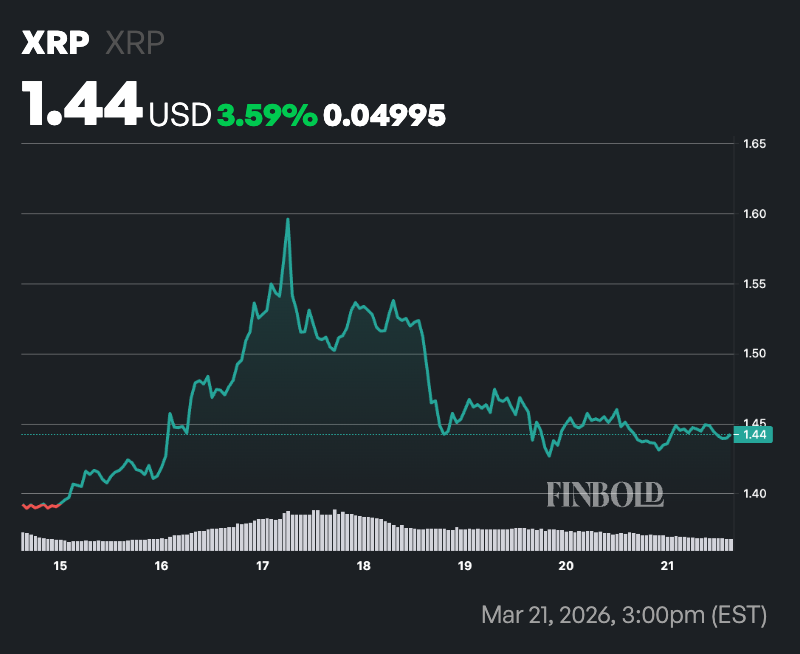
The outlook comes after the cryptocurrency briefly rose to between $1.50 and $1.57 around March 17 before pulling back amid macro-driven caution, including the March 18 Federal Reserve decision. After breaking $1.45 on strong volume, momentum stalled, leaving the price range-bound.
At the same time, regulatory clarity from U.S. authorities classifying XRP as a digital commodity has been viewed positively but has yet to translate into a sustained rally.
XRP price analysis
By press time, XRP was trading at $1.45, having dropped 0.3% in the past 24 hours, while on the weekly chart the asset is up almost 4%.
At the current price, XRP is sitting directly on its 50-day simple moving average, signaling short-term equilibrium but a lack of clear momentum.
However, the price remains well below the 200-day simple moving average at $2.14, indicating that the broader trend is still bearish.
The 14-day relative strength index (RSI) stands at 50.69, reflecting neutral momentum with neither overbought nor oversold conditions.
This suggests the market is in a consolidation phase, though positioning below the long-term moving average tilts the overall outlook to the downside unless stronger buying pressure emerges.
Featured image via Shutterstock