
The ongoing inversion of the U.S. Treasury yield curve, now stretching to 21 months, is igniting discussions among economists and investors about the potential onset of a recession. This prolonged inversion is unusual in its duration and severity, challenging established economic forecasts.
This is the longest inversion since the 1920s, a period that historically preceded severe economic downturns. Yet, the current economic indicators—GDP growth, steady consumer spending, record stock market highs, and low unemployment—seem to tell a different story.
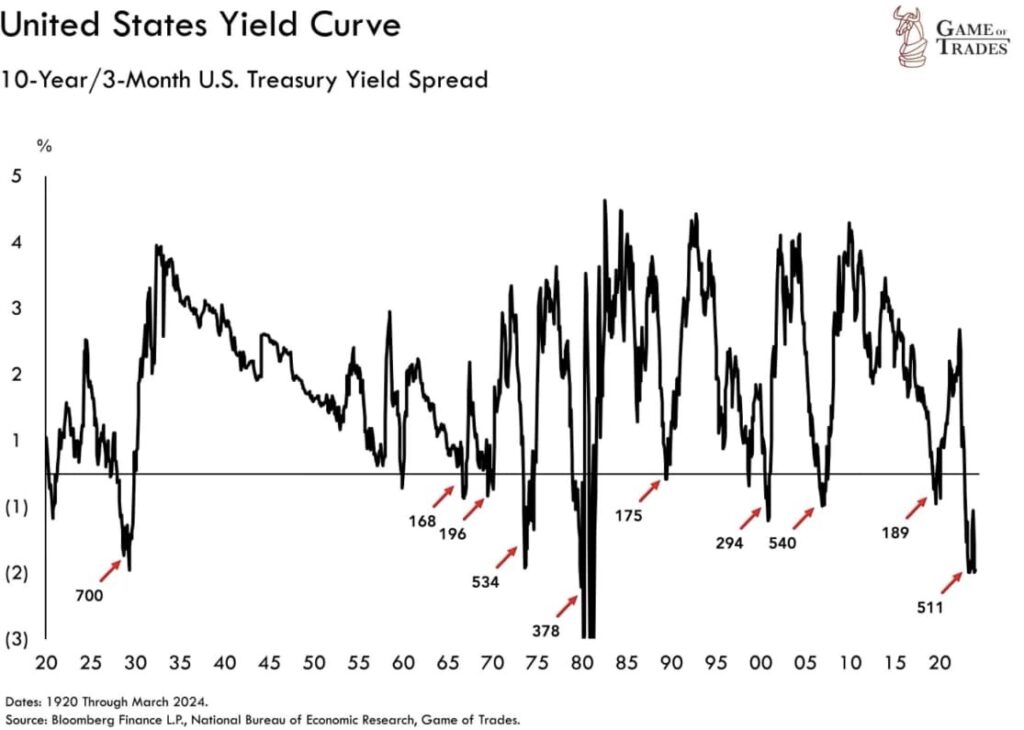
On April 22, the data-driven investment research platform Game of Trades, in an X (formerly Twitter) post, highlighted the historical context and current scenarios.
This revolves around the 10-year/3-month US Treasury curve, an indicator historically known for its ability to predict economic downturns.
“The yield curve has been inverted for 21 months Yet the recession is still a no-show
Is this time different?” the platform stated.
Understanding yield curve
The yield curve illustrates the connection between short-term and long-term interest rates and has long been a dependable indicator of economic downturns. Investors typically demand higher yields when investing their money for longer periods of time.
As of data from 2021, the yield on 3-month Treasury bills stood at 0.05% and moved progressively higher as maturities extended along the yield curve, reaching a yield of 1.90% on 30-year Treasury bonds. This pattern is referred to as a normal, upward-sloping yield curve
Historical context and current scenario
The inversion began in 2022 and has persisted despite contradictory economic signals. Historically, prolonged inversions have often preceded severe economic downturns. For instance, the 2006 inversion lasted around 530 days, coinciding with a substantial 60% stock market decline.
Conversely, the 1989 inversion, lasting approximately 175 days, led to a milder recession in 1990. This suggests a correlation between the duration of an inversion and the severity of its subsequent economic impact
In late October 2022, the yield on the very short-term 3-month Treasury bill moved above that of the 10-year Treasury note, marking the beginning of the inversion. The inversion has continued since that time, though the shape of the curve has changed
The inversion today is flatter than it was during periods in 2023, with a 0.80% spread between short-term and long-term Treasury yields. This suggests a nuanced economic landscape where the traditional yield curve inversion may not follow historical patterns precisely.
Resilience amidst challenges
Despite challenges posed by the inverted yield curve, the U.S. economy has demonstrated resilience.
The stock market, as evidenced by the Dow Jones Industrial Average (DJIA), reached a record high of 39,131.53 points on February 23, 2024, defying traditional recessionary signals.
Additionally, economic growth has remained steady, with real Gross Domestic Product (GDP) expanding at a rate of 2.5% in 2023.
The labor market has also shown strength, with a low unemployment rate likely below 4%, further bolstering the case for economic resilience.
Potential factors influencing future trends
While the lack of external shocks, such as oil crises or market crashes in the current scenario, could mitigate the potential impact of the inversion, the global economic environment remains uncertain.
Geopolitical tensions and policy shifts could act as new triggers, highlighting the need for adaptive economic strategies.
While the prolonged yield curve inversion traditionally signals caution, the combination of strong economic performance and potential delays in its impact suggests that the markets and the economy might not adhere to historical patterns precisely.
Investors and policymakers would need to carefully consider these factors, alongside current economic data and global conditions, to navigate the evolving economic landscape effectively.