Skip to content

To keep going please Log in.

or

By submitting my information, I agree to the Privacy Policy and Terms of Service.

To keep going please Log in.

or

By submitting my information, I agree to the Privacy Policy and Terms of Service.

To keep going please Log in.

or

By submitting my information, I agree to the Privacy Policy and Terms of Service.

To keep going please Log in.

or

By submitting my information, I agree to the Privacy Policy and Terms of Service.

Warning: S&P 500 flashes start of bear cycle 

Warning: S&P 500 flashes start of bear cycle
Paul L.
Stocks

The S&P 500 is sending early warnings that a broader market downturn may be unfolding after the index slipped below its 50-day moving average (MA) and closed beneath that level on Monday, reinforcing weakening short-term momentum.

Notably, the index has extended its losses, trading at 6,630.21 as of press time, a drop of 0.6% in the past day.

Now, technical signals on the daily and weekly timeframes suggest the ongoing pullback could evolve into something more significant if current conditions persist, according to insights by TradingShot posted on TradingView on November 18.

S&P 500 price analysis chart. Source: TradingView

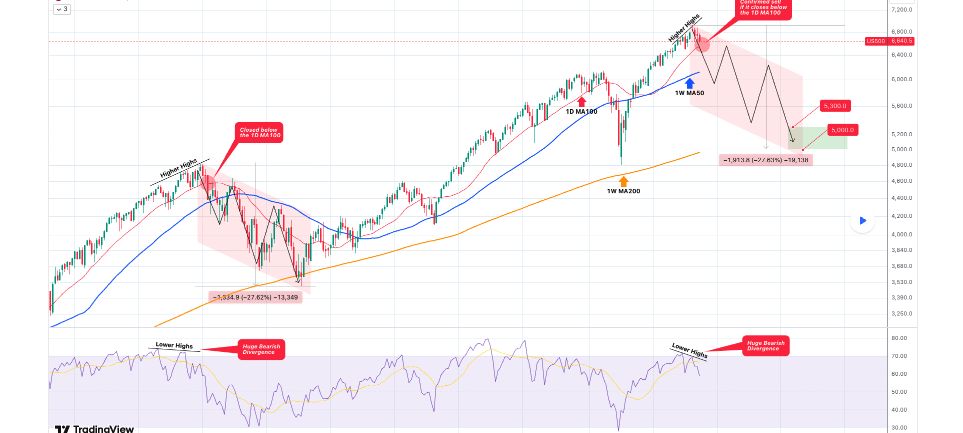
According to the analysis, a key concern is the persistent bearish divergence forming on the weekly RSI. Even as the index has been printing higher highs, the RSI has been trending lower since late October, mirroring the setup seen in mid-November 2021.

At that time, the divergence preceded one final rally before the bull cycle peaked, eventually giving way to the 2022 inflation-driven bear market. The current outlook shows a similar structure, with lower RSI highs contradicting price strength and hinting at fading underlying momentum.

Another crucial level highlighted in the analysis is the 100-day moving average, which has served as the market’s primary support throughout the past five months and during major up-legs of the broader bull cycle.

S&P 500 key price levels to watch 

A weekly close below this trend line would represent a structural breakdown, historically the point at which bullish cycles have transitioned into bearish phases.

If that breakdown is confirmed, technical projections suggest the S&P 500 could retrace toward the 200-week moving average, the long-term support zone that marked the bottom of the 2022 bear cycle after a decline of roughly 27.6%.

Based on current price levels, the next major accumulation zone is estimated around 5,300 to 5,000, assuming the recent peak holds. Should the index form a new high before rolling over, the downside levels would adjust accordingly to reflect a similar proportional correction.

The technical outlook comes as bearish sentiment spreads into the crypto market as well. Despite the warning signs, a section of Wall Street remains bullish, with some analysts projecting the benchmark index could still reach 7,000 next year.

Featured image via Shutterstock

Best Crypto Exchange for Intermediate Traders and Investors

  • Invest in cryptocurrencies and 3,000+ other assets including stocks and precious metals.

  • 0% commission on stocks - buy in bulk or just a fraction from as little as $10. Other fees apply. For more information, visit etoro.com/trading/fees.

  • Copy top-performing traders in real time, automatically.

  • eToro USA is registered with FINRA for securities trading.

30+ million Users worldwide
Securities trading offered by eToro USA Securities, Inc. (“the BD”), member of FINRA and SIPC. Cryptocurrency offered by eToro USA LLC (“the MSB”) (NMLS: 1769299) and is not FDIC or SIPC insured. Investing involves risk, and content is provided for educational purposes only, does not imply a recommendation, and is not a guarantee of future performance. Finbold.com is not an affiliate and may be compensated if you access certain products or services offered by the MSB and/or the BD

Latest posts

Finance Digest

By subscribing you agree with Finbold T&C’s & Privacy Policy

Related posts

Stocks

Finbold AI Agent

How AI Price Predictions Work

We use cutting-edge AI models to forecast future prices for stocks and crypto.

Trade, Swap & Stake Crypto on Uphold

Buy, sell, and swap crypto. Stake crypto, earn rewards and securely manage 300+ assets—all in one trusted platform. Terms apply. Capital at risk.

Get Started

IMPORTANT NOTICE

Finbold is a news and information website. This Site may contain sponsored content, advertisements, and third-party materials, for which Finbold expressly disclaims any liability.

RISK WARNING: Cryptocurrencies are high-risk investments and you should not expect to be protected if something goes wrong. Don’t invest unless you’re prepared to lose all the money you invest. (Click here to learn more about cryptocurrency risks.)

By accessing this Site, you acknowledge that you understand these risks and that Finbold bears no responsibility for any losses, damages, or consequences resulting from your use of the Site or reliance on its content. Click here to learn more.