The following guide will examine what the moving average (MA) is in stock trading, what it measures, its various types, how to understand the indicator on charts and interpret those findings, as well as some of the weaknesses of using this technical analysis tool.
Best Crypto Exchange for Intermediate Traders and Investors
-
Invest in cryptocurrencies and 3,000+ other assets including stocks and precious metals.
-
0% commission on stocks - buy in bulk or just a fraction from as little as $10. Other fees apply. For more information, visit etoro.com/trading/fees.
-
Copy top-performing traders in real time, automatically.
-
eToro USA is registered with FINRA for securities trading.
Moving average definition
Moving averages can be tailored to any time frame, depending on the trader’s preferences and strategy. As a technical indicator, a moving average appears as a smooth, curving line that visually represents a security’s longer-term trend. Faster moving averages with shorter lookback periods are choppier. Slower moving averages, on the other hand, with longer lookback periods, are smoother.
Short-term (e.g., 10- or 20-day) moving averages may be of analytical benefit to a shorter-term trader since they follow the price more closely and, as such, produce less lag than the longer-term moving average. Conversely, long-term traders might prefer a long-term (e.g., 200-day) moving average since it creates fewer buy and sell signals and is smoother.
Beginners’ corner:
- What is Investing? Putting Money to Work
- 17 Common Investing Mistakes to Avoid
- 15 Top-Rated Investment Books of All Time
- How to Buy Stocks? Complete Beginner’s Guide
- 10 Best Stock Trading Books for Beginners
- 15 Highest-Rated Crypto Books for Beginners
- 6 Basic Rules of Investing
- Dividend Investing for Beginners
- Top 6 Real Estate Investing Books for Beginners
- 5 Passive Income Investment Ideas
Types of Moving averages
There are three primary types of moving averages: Simple moving average (SMA), weighted moving average (WMA), and exponential moving average (EMA).
Simple moving average (SMA)
A simple moving average is calculated by summing recent prices in a given data set and then dividing that figure by the number of time periods in that set. A simple moving average is typically based on daily closing prices but can also be calculated for other timeframes, such as the opening or median price.
For instance, a 10-day simple moving average is the ten-day sum of closing prices divided by ten. As the name suggests, a moving average is an average that moves. Old data is eliminated as new data becomes available, causing the average to move along the time scale. Each data point is weighted equally in the SMA, regardless of whether it happened yesterday or a month ago.
Simple moving average formula
The formula for calculating SMA is as follows:
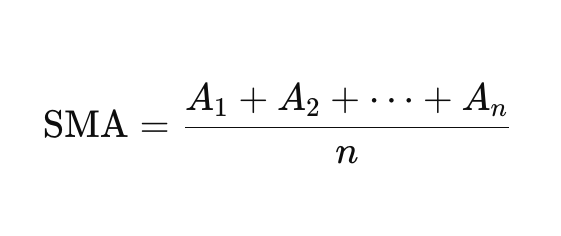
Where:
- A = Average in period n;
- n = number of time periods.
Example simple moving average calculation
Let’s imagine you want to calculate the simple moving average for stock X by looking at the stock’s closing prices for the last five days. For example, the closing prices for stock X for the previous five days are as follows: $15, $15.5, $16, $15.7, and $16.5. The SMA is then calculated as follows:
SMA = ($15+ $15.5 + $16 + $15.7 + $16.5) / 5
SMA = $15.74
Weighted Moving Average (WMA)
Unlike simple moving averages, where all numbers are assigned an equal weighting, weighted moving averages give a heavier weighting to more recent data points as they are more relevant than past data points. As a result, the sum of the weighting should be equal to 1 or 100%.
Weighted moving average formula
The weighted moving average is calculated by multiplying the given price by its associated weighting and totaling the values. The formula for the WMA is expressed as follows:
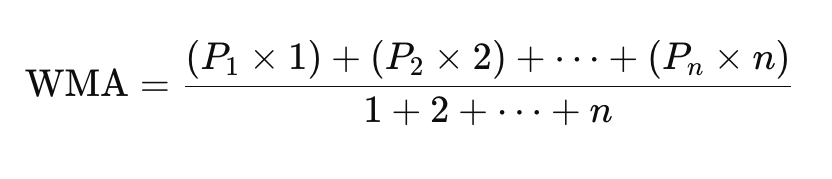
Where:
- Pn is the price at each time period;
- The weights 1, 2,…, n increase with each period, giving more importance to recent data.
Example weighted moving average calculation
Let’s now calculate the weighted moving average for stock X, whose closing prices for the previous five days are as follows: $15, $15.5, $16, $15.7, and $16.5, with the last number being the most recent.
The next step is to establish the weight of each number. To do this, we give the highest weighting to the most recent data point out of an arbitrary 15 points (this can be any value you see appropriate). Therefore: 16.5 – 5/15, 15.7 – 4/15, 16 – 3/15, 15.5 – 2/15, 15 – 1/15.
After establishing the weighting for each number, the next step is multiplying each number by the corresponding weighting factor and then summing up the resulting values:
(16.5 x 5/15)+(15.7 x 4/15)+(16 x 3/15)+(15.5 x 2/15)+(15 x 1/15) = 5.5 + 4.2 + 3.2 + 2.1 + 3 = 18
The higher value from the weighted average compared to the simple average suggests that stock prices are rising.
Exponential Moving Average (EMA)
Like a weighted moving average, an exponential moving average, also referred to as the exponentially weighted moving average, responds more significantly to recent price changes than an SMA, which applies an equal weight to all findings in the period.
Though EMAs are also weighted toward the most recent prices, the rate of decrease between one price and its preceding price is not entirely consistent. Instead, the difference in the decline is exponential.
So, rather than every weight being 1.0 smaller than the weight preceding it, there may be a difference between the first two period weights of 1.0 and 1.3 for the two periods after those periods, etc.
Exponential moving average formula
The formula for the EMA is expressed as follows:
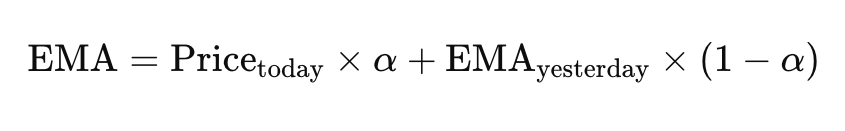
Where:
- α is the smoothing factor, calculated as α = 2 / (n+1) where n is the number of periods.
There are many possible choices for the smoothing factor. However, the most common choice is 2. That gives the most recent observation more weight. Therefore, if the smoothing factor is increased, more recent figures influence the EMA more significantly.
Exponential moving average calculation
Calculating an EMA involves three steps:
- Determine the SMA for the period: The sum of the asset’s closing prices during a specified time period, divided by the number of observations for that period;
- Next, calculate the multiplier for smoothing (weighting) the EMA by taking two divided by the number of periods plus one. For example, for a 10-day moving average, the multiplier would be [2/(10+1)]= 0.1818;
- Finally, this formula calculates the current EMA: Closing price x multiplier + EMA (previous day) x (1-multiplier).
Unlike the SMA, the EMA gives a higher weight to more current values. Additionally, the weighting given to the most recent price is more significant for a shorter-period EMA than for a longer-period EMA.
For instance, per the example above, an 18.18% multiplier is applied to the most recent price data for a 10-period EMA. Conversely, the weight is only 9.52% ([2/(20+1)]) for a 20-period EMA. Moreover, slight variations of the EMA are arrived at using the open, high, low, or median price rather than the closing price.
Moving average length
Typical moving average lengths are 10, 20, 50, 100, and 200, but they can also be any variety of lengths. Depending on the trader’s time horizon (the amount of time an investment is held until it’s needed), such lengths may be applied to any chart time frame (e.g., one minute, daily, weekly). The time frame or length chosen for a moving average, i.e., the lookback period, can significantly affect its effectiveness.
For example, an MA with a long time frame will react much slower to price changes than an MA with a short lookback period. The 20-day moving average may be of analytical benefit to a shorter-term trader since it follows the price more closely and, as such, produces less lag than the longer-term moving average. On the other hand, a longer-term trader might prefer a 100-day MA.
Lag is the amount of time it takes for a moving average to cue a possible reversal (change in a security’s price direction). Generally, the trend is considered up when the price is above a moving average.
Conversely, when the price drops below that moving average, it signals a potential reversal based on that MA. Notably, a 20-day MA will deliver many more reversal signals than a 100-day MA. Adjusting the moving average to provide more accurate historical data signals can help create better future signals.
Uses of moving averages
Moving averages are an essential analytical instrument used to identify current price trends and the potential for a change in an already established trend. While predicting a specific stock’s future movement is impossible, technical analysis and research can help make better predictions.
Utilizing moving averages is an effective strategy for eliminating strong price fluctuations. Analysts and investors use the moving average indicator in financial markets to signal when to enter or exit a market.
Simple moving averages and crossovers
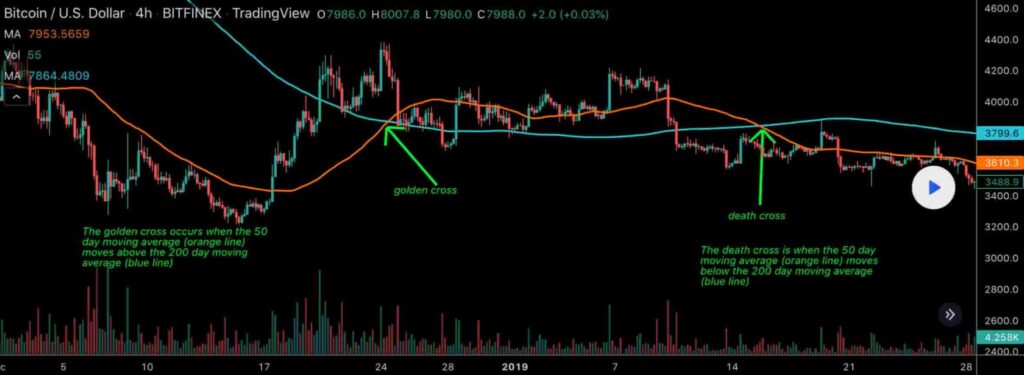
The most straightforward use of an SMA in technical analysis is to quickly determine if an asset is in an uptrend or downtrend by distinguishing whether the price crosses above or below a moving average. This process is referred to as the price crossover.

Another analytical use is to compare a pair of simple moving averages with each covering different time frames (one longer and one shorter), called a moving average crossover.
For example, the technical indicator known as the death cross occurs when the 50-day SMA crosses below the 200-day SMA, which is considered a bearish signal. Conversely, an opposite indicator, known as the golden cross, is created when the 50-day SMA crosses above the 200-day SMA, which is then regarded as a bullish signal.
Uses of exponential moving average
The 12- and 26-day EMAs are often the most quoted and analyzed short-term averages. They can be used to create indicators like the moving average convergence divergence (MACD) and the percentage price oscillator (PPO). On the other hand, the 50- and 200-day EMAs are used as indicators for long-term trends. For example, when a stock price crosses its 200-day moving average, it is a technical signal that a reversal has occurred.
All the MAs typically employed in technical analysis are lagging indicators. Consequently, they should predominately be used to confirm a market move or to indicate its strength. Unfortunately, the optimal time to enter the market often passes before a moving average shows that the trend has changed.
An EMA alleviates the adverse impact of lags to a degree since it places more weight on the latest data, hovers around the price action more tightly, and reacts more quickly, which is desirable when an EMA is used to derive a trading entry signal.
Like all moving average indicators, EMAs work much better in trending markets. For example, the EMA indicator line will exhibit an uptrend when the market is in a substantial uptrend and vice-versa for a downtrend.
Analysts will consider both the direction of the EMA line and the relation of the rate of change (the speed at which a price changes over a specific period) from one bar to the next. For instance, suppose the price action of a strong uptrend begins to flatten and reverse. From an opportunity cost (the potential profit from an opportunity not chosen) point of view, it might be smart to change to a more bullish investment.
The PPO is a momentum indicator that displays the relationship between a 26-period and 12-period EMA. It is used to compare asset performance and volatility, and spot divergence that could lead to price reversals, generate trade signals, and help confirm trend direction.
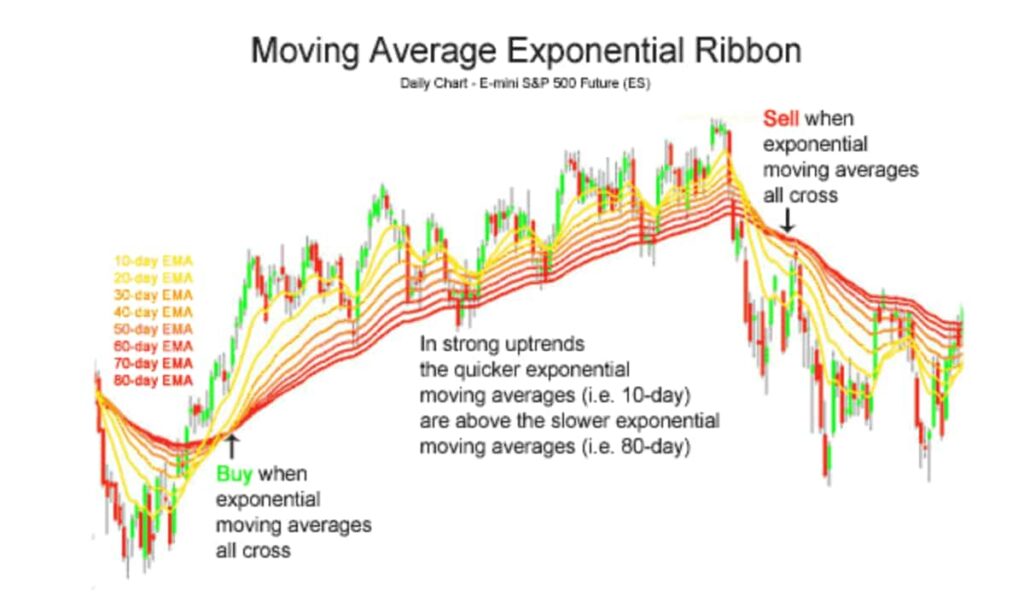
Moving average ribbons
Traders sometimes utilize moving average ribbons, which plot a series of moving averages (both SMAs and EMAs can be used) onto a price chart to create a ribbon-like indicator. They offer a straightforward way of visualizing the dynamic relationship between trends in the short, intermediate, and long-term.
Analysts and traders rely on moving averages and ribbons to identify overbought/oversold conditions, turning points, and continuations, define support and resistance areas, as well as measure trend strengths.
Buy signals are triggered when shorter-term moving averages cross above the longer-term moving averages from below. In contrast, sell triggers are indicated when shorter moving averages cross down from above.
Difference between moving averages: SMA, WMA, and EMA
Since an exponential moving average tends to show more sensitivity to recent price point changes, it is often regarded as a better indicator of a trend than a WMA or SMA. In addition, the EMA is more responsive to changes in trends.
Conversely, the more basic weighting delivered by the SMA may make it more appropriate to locate simple support and resistance areas on a chart. Ultimately, all moving averages typically smooth price data that can otherwise be visually noisy.
The purpose of an EMA and a WMA are similar since they both rely more heavily on the most recent values and place less value on past prices. They are preferred over SMAs if there is a concern that the effects of lags in data may lower the responsiveness of the MA indicator.
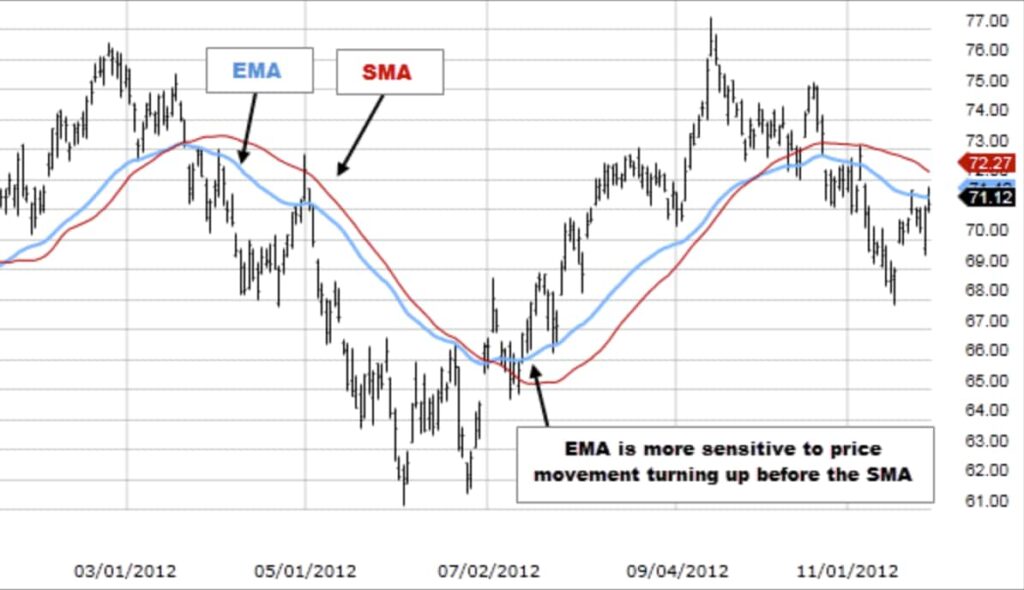
The calculation makes the EMA react to price changes quicker, and the SMA react slower. So sometimes, the EMA will respond quickly, causing a trader to get out of a profitable trade on a market hiccup. At the same time, the slower-moving SMA keeps the person in the trade, resulting in a heftier gain after the hiccup is over. However, the opposite can also occur, making the faster-moving EMA more beneficial as it signals trouble quicker than the SMA.
What type of moving average is the right one for me?
Each trader must decide what moving average is better for their particular strategy. For example, many shorter-term traders use EMAs because they want to be alerted as quickly as possible of any price movements the other way. Longer-term traders, on the other hand, tend to prefer SMAs because they’re not in a rush to act and can be less actively engaged in their trades.
In the end, it comes down to personal preference. It helps to plot an EMA and SMA of the same length on a chart for a visual aid of which one you help make better trading decisions.
Generally, when the value is above a simple, weighted, or exponential moving average, the trend is up (bull market), and when the price is below the moving average, the trend is down (bear market). Test out various types of MAs to see which works best by altering the inputs on the indicator in your charting platform; some MAs can work better than others on different financial instruments.
Pros and cons of moving averages

Pros
- Trend identification: Moving averages filter out market noise, making it easier to spot the direction of the underlying trend, whether bullish, bearish, or neutral. This helps traders align their trades with the prevailing market direction;
- Support and resistance levels: Moving averages can act as dynamic support and resistance levels. Prices often bounce off moving averages, providing traders with potential entry and exit points;
- Signal generation: Crossovers, such as when a short-term moving average crosses above or below a long-term one, can signal potential buy or sell opportunities. This helps traders make timely decisions;
- Simplicity: Moving averages are simple to use and can be applied to various markets and timeframes, making them a versatile tool for both beginners and experienced traders. They can be easily integrated with other technical indicators to refine trading strategies.

Cons
- MAs are lagging indicators: Moving averages are based on past data and thus suffer a time lag before reflecting a trend change. For example, a stock price may move sharply before a moving average can show a trend change. As a result, a shorter moving average suffers from less lag than a longer moving average;
- Calculations are not predictive: Results utilizing MAs can be random. Sometimes, the market seems to respect MA support/resistance and trade signals, and at other times, it does not;
- The difficulty of trend identification: If the price action becomes choppy, one major problem is that the value may heavily fluctuate, generating multiple trend reversals or trade signals. If this happens, it’s best to step aside or use another indicator to help clarify the trend. The same thing can happen with MA crossovers when the MAs get “tangled up” for some time, triggering multiple losing trades;
- Poor performance in choppy markets: Moving averages work pretty well in solid trending conditions but relatively poorly in choppy or ranging conditions. This can be fixed by adjusting the time frame; though, often, these issues can occur regardless of the time frame applied for the MA.
Best Crypto Exchange for Intermediate Traders and Investors
-
Invest in cryptocurrencies and 3,000+ other assets including stocks and precious metals.
-
0% commission on stocks - buy in bulk or just a fraction from as little as $10. Other fees apply. For more information, visit etoro.com/trading/fees.
-
Copy top-performing traders in real time, automatically.
-
eToro USA is registered with FINRA for securities trading.
In conclusion
To sum up, a moving average is a valuable indicator, and its simplicity has made it popular among many traders and analysts. It’s an essential tool for smoothing out price data to discover broader market trends and determine good entry and exit points.
There are various types of moving averages, simple moving averages and exponential moving averages being the most commonly used. One type is not necessarily better, and your preferred trading strategy will usually determine which method will best suit you.
However, moving averages should never be used in isolation for traders who solely trade off technical analysis due to their lagging nature. Instead, they should be utilized in conjunction with other technical indicators.
Read our other guides on technical analysis (TA):
- What is Technical Analysis (TA)? | Definition & Trading Examples
- Head and Shoulders Pattern Explained | Technical Analysis (TA)
- Bollinger Bands | Technical Analysis Indicator Explained
- Average Directional Index (ADX) | Definition & Examples
- Stochastic Oscillator Explained | Definition & Examples
- What is Fundamental Analysis (FA)?
Disclaimer: The content on this site should not be considered investment advice. Investing is speculative. When investing, your capital is at risk.
FAQs about moving averages
What is a moving average?
A moving average (MA) is a technical indicator that refers to an average for a particular trading instrument over a specified period. By creating a continuously updated average price that smooths out price data, investors, traders, and analysts can use moving average indicators to track and identify trends as well as entry and exit points.
What is the difference between an SMA and an EMA?
While a simple moving average gives equal weight to each value within a period, an exponential moving average places greater weight on recent prices. As a result, EMAs are generally considered a more timely indicator of a price trend and therefore preferred by many analysts over an SMA.
What is the main drawback of using moving averages?
All moving averages have a significant disadvantage in that they are lagging indicators. Since moving averages are based on historical data, they suffer a time lag before reflecting a trend change. For example, a stock price may move sharply before a MA can indicate a trend change. However, a shorter MA will suffer from less lag than a longer MA.
How do moving averages create support and resistance levels?
If the price is above a MA, it can act as a strong support level, i.e., if the price does fall, the price might have a more difficult time declining below the MA price level. Conversely, if the price is below a MA, it can serve as a strong resistance level, i.e., if the price were to increase, it would still struggle to rise above the MA. Therefore, if the price falls below a support level, that can indicate a short-term sell signal. Alternatively, it would be regarded as a short-term buy signal if it rises above a resistance level.
How to use a simple moving average for buy and sell signals?
Traders can compare a pair of simple moving averages, each covering different time frames. This method is called a moving average crossover and involves either buying or selling when a shorter MA crosses a longer MA. For instance, the golden cross, signaling a long position, occurs when the 50-day SMA crosses above a 200-day SMA. Alternatively, a death cross, suggesting a sell, occurs if a 50-day SMA crosses below a 200-day SMA.
What's the triple moving average crossover?
The triple moving average crossover is a trading strategy involving three moving averages of different time frames: short, medium, and long-term. Traders observe for crossovers where these averages intersect to predict price movements: a bullish signal when the short-term average crosses above the others, and a bearish signal when it falls below. This strategy aims to provide a more reliable analysis by reducing the volatility and false signals of a single moving average, though it should be used with other analysis methods for best results.
What are the top 3 moving averages?
The top three moving averages are the Simple Moving Average (SMA), which averages prices over a set period; the Exponential Moving Average (EMA), which gives more weight to recent prices; and the Weighted Moving Average (WMA), which also emphasizes recent data but with linearly decreasing weights.
What is the most respected moving average?
The most respected moving average is the Exponential Moving Average (EMA) because it gives more weight to recent prices, making it more responsive to new information.