
Based on the S&P 500 index’s ability to influence the stock market, there seems to be an overall consensus that the benchmark is potentially set for more gains, with 6,000 points being the minimal target for the next record high.
In keeping with the bullish outlook, a trading expert has observed that the index is destined to hit 6,300 points, citing technical indicators that align with the S&P 500’s resilience, having maintained its position above the 50-day moving average, TradingShot observed in a TradingView post on October 9.
According to TradingShot, this technical setup suggests that the long-term bullish trend remains intact. The analyst observed that the index has consolidated for approximately three weeks and appears to have entered a channel up structure reminiscent of the market’s behavior from November 2023 to March 2024.
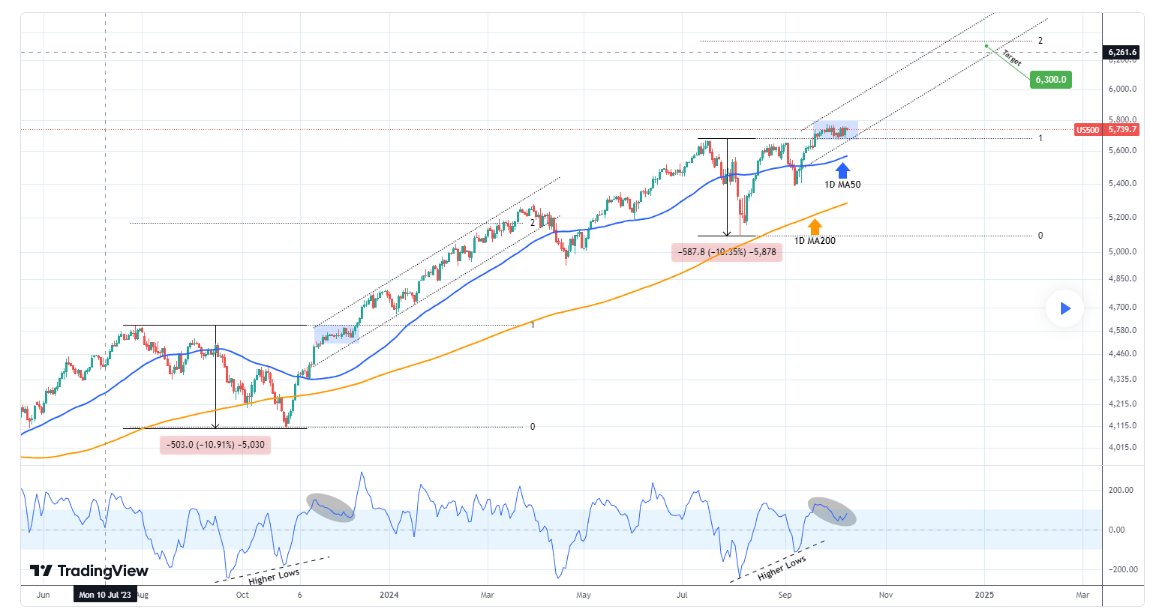
During that earlier period, the S&P 500 was also in a consolidation phase, above its 1D MA50, following a notable recovery from a correction of 10.90%. Currently, the index is consolidating at the peak of its previous high, indicating strong bullish momentum that could drive prices higher in the coming months.
Looking ahead, TradingShot anticipates a gradual expansion within the channel structure as the end of the year approaches, despite potential volatility surrounding the U.S. elections. In this case, the expert set the target of 6,300, which aligns with the 2.0 Fibonacci extension level.
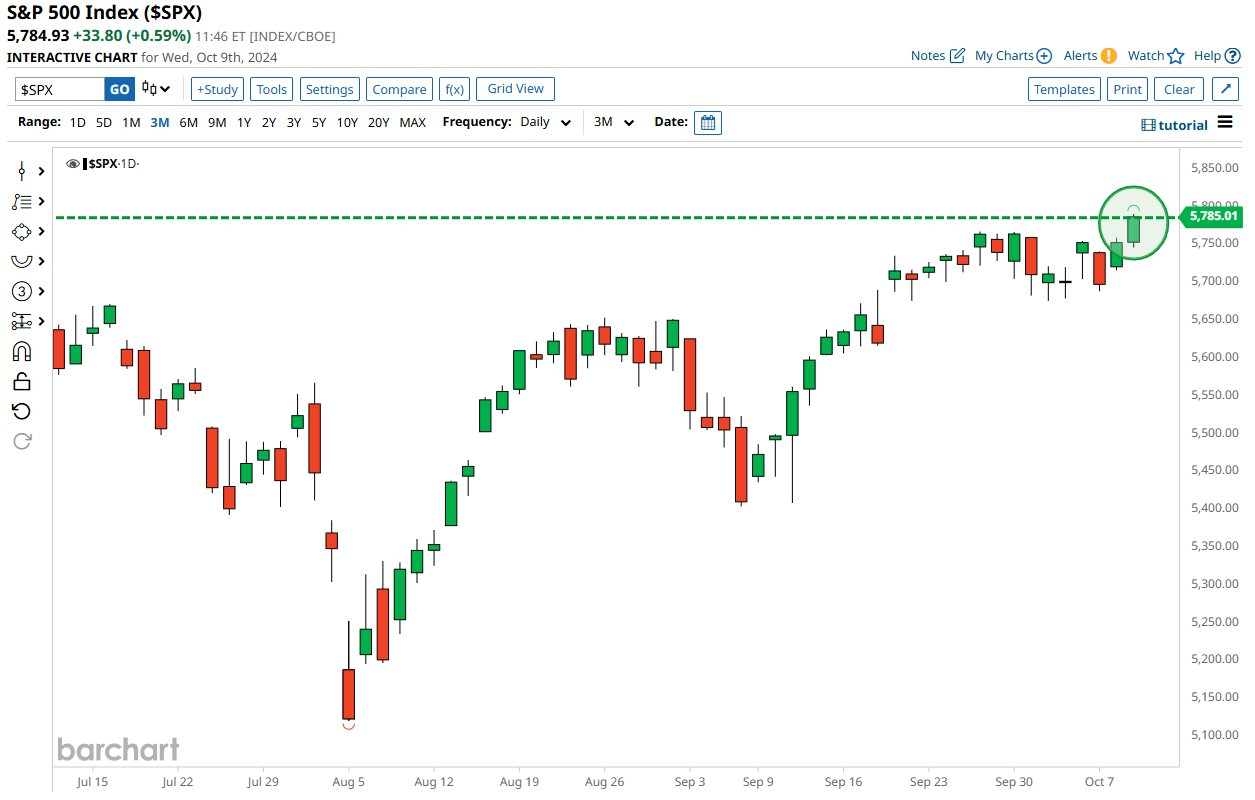
S&P 500 hits a new record high
Amid the market projection, the S&P 500 is trading at a new all-time high as of press time, with a valuation of 5,785, reflecting year-to-date gains of 21%.
Before hitting the current levels, an analyst with the pseudonym Hulk Capital had observed that breaching the 5,765 resistance could pave the way for further upside momentum. The analyst noted that the S&P 500 Relative Strength Index (RSI) sits at 60.70, showing that it’s approaching overbought territory but still has room to run.
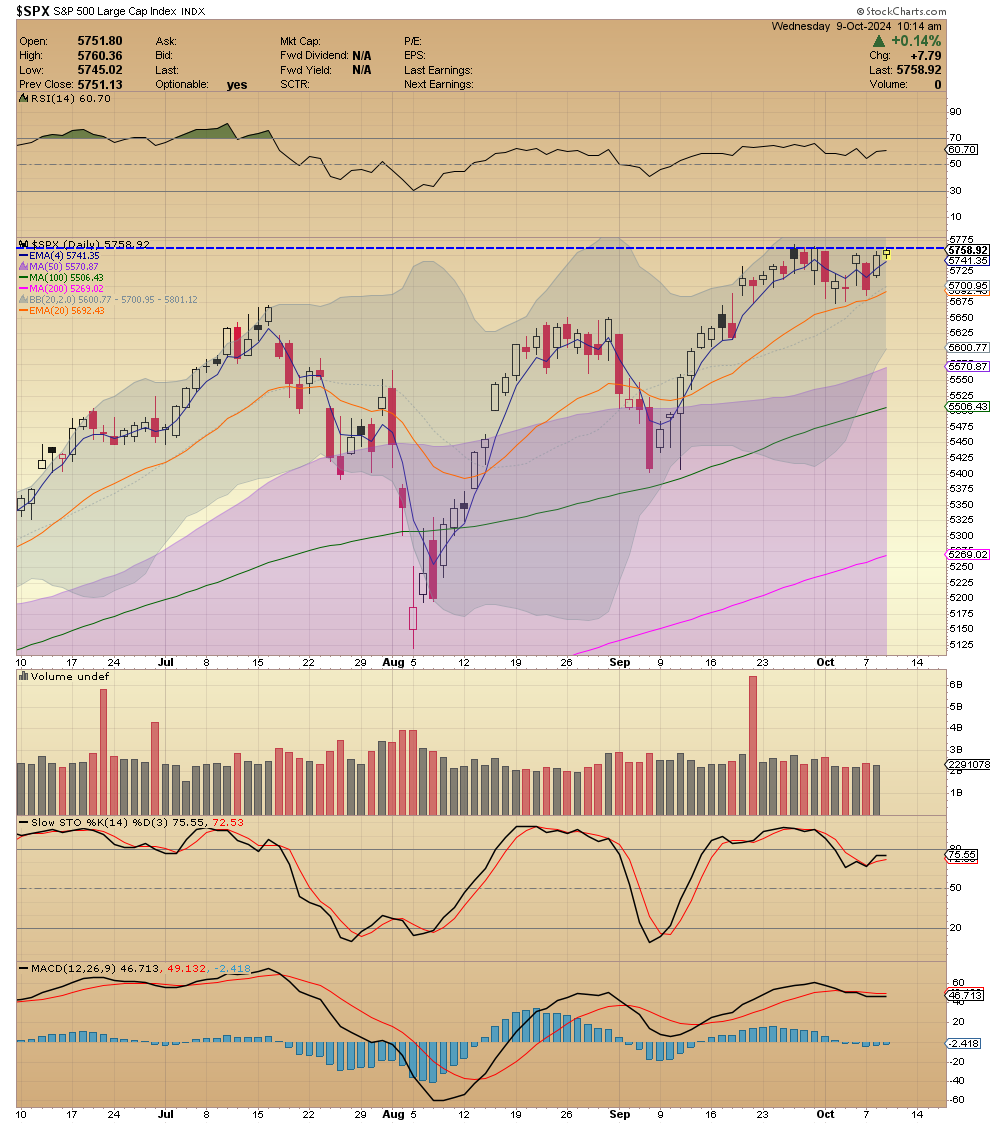
At the same time, the Moving Average Convergence Divergence (MACD) is trending higher, with bullish crossovers in play. The slow stochastics also show the index nearing higher levels, with a reading of 75.53.
On the flip side, a pullback toward crucial support levels around 5,500 remains possible should the index fail to hold above the resistance.
More bullish outlook for S&P 500
As things stand, if the bullish momentum is sustained, most market players believe the index will potentially reach at least 6,000 as the next record high. Goldman Sachs (NYSE: GS) analysts share this sentiment, projecting the index will hit this level by the end of the year, with the potential to extend to 6,300.
Moreover, not all view this bullish outlook as sustainable, with economist Henrik Zeberg warning that hitting the next high will be the precursor for a broader market correction. As a recap, the index is leading the stock market rally after the Federal Reserve interest rate cut while remaining unfazed by the geopolitical tensions in the Middle East.