
On October 8, widespread selling occurred in Chinese stock markets, leading the Hong Kong Hang Seng Index to close 9.41% lower than the previous day — its worst daily performance since 2008.
Although most stocks were hit hard — with Michael Burry favorites such as Alibaba Group (HKG: 9988) and JD.com (HKG: 9618) shedding 8.81% and 11.94%, respectively, the worst hit Chinese company was Nio (HKG: 9866), which saw a 14.51% reduction in share price, while its Singaporean component (SGX: NIO) lost 13.89%.
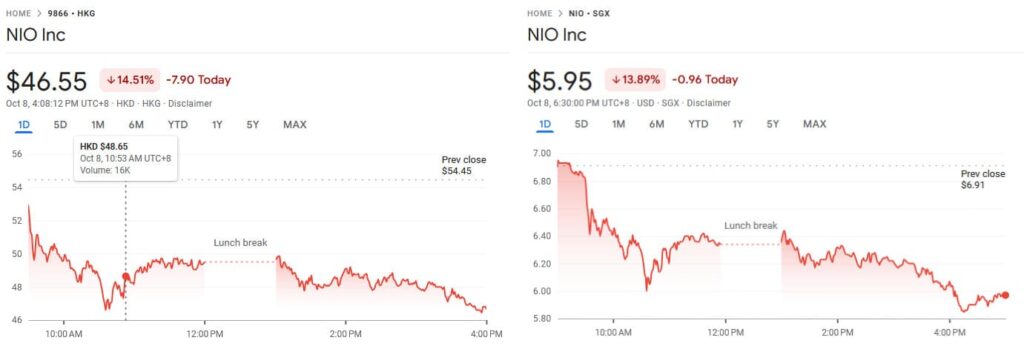
Weak stimulus measures stifle NIO
The selloff follows an announcement from China’s National Development and Reform Commission (NDRC) — after the strong stimulus measures announced on September 24, which saw $142 billion freed up for new lending, and reserve requirement ratios relaxed, investors shifted gears, expecting that the new turn in terms of policy will be sustained, driving up prices.
However, this newest announcement brought none of the expected sweeping changes — with the only specific figure mentioned being that 100 billion Yuan (roughly $14 billion) in funds will be frontloaded from the 2025 central budget for short-term use.
However, even this was sorely disappointing — since it was just an advance from existing funds. The issue is further exacerbated by the ongoing dispute surrounding European tariffs on Chinese electric vehicles, which could go as high as 35.3%.
What will happen with NIO’s U.S. listing?
NIO’s (NYSE: NIO) U.S. listing tends to exhibit the same price action as the Chinese listings — while short-term fluctuations do occur, the underlying fundamentals are the same.
Even though NIO has seen a string of good news over the short term — strong Q2 earnings, good metrics in terms of deliveries in Q3, as well as a $470 million strategic investment, it appears that the lack of stimulus has stopped NIO’s recovery in its tracks.

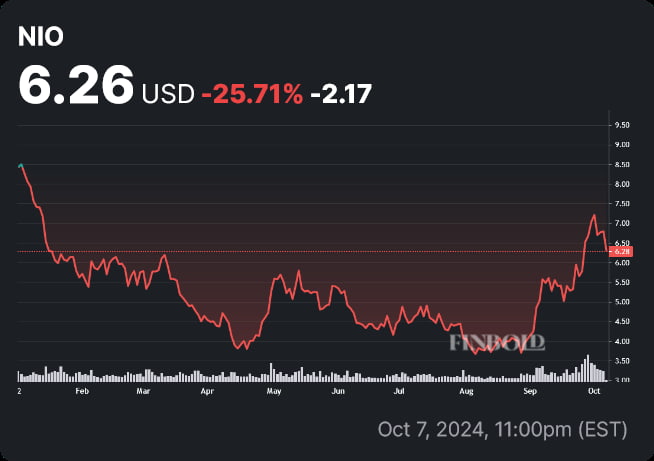
At press time, the stock is down 25.40% year-to-date (YTD) — and although it has gained 40% over the course of the last six months, further decreases in share price are to be expected.
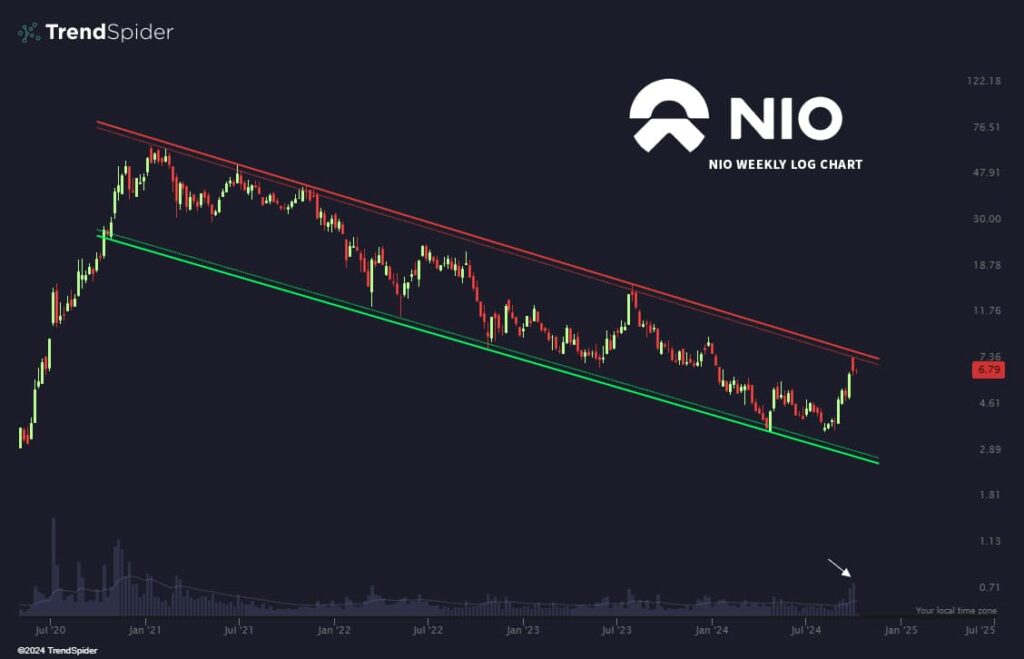
Earlier, researchers from technical analysis platform TrendSpider noted that the stock was in a four-year descending parallel channel — a bearish chart pattern.
While there was a recent surge to the upside on strong volume, the news from China makes a bullish breakout almost impossible — and, conversely, increases the odds that the stock will reach, test, and possibly breach support at the lower channel line, potentially leading to significant losses.
All odds are that the U.S. listing will post similar losses in the short term, with share prices falling from the current level of $6.26 to roughly $5.3 in the best-case scenario.
With that being said, although the hopes of a bull run haven’t materialized, the company has still seen a string of good news regarding production and fundamentals — should that trajectory be sustained, investors and traders might have an opportunity to acquire equity at a more reasonable valuation for longer term, buy-and-hold plays.