
Summary
⚈ A move to the 1.382 Fibonacci extension suggests a target near 22,000.
⚈ Easing U.S.-China tensions and $2 trillion inflows may boost investor confidence.
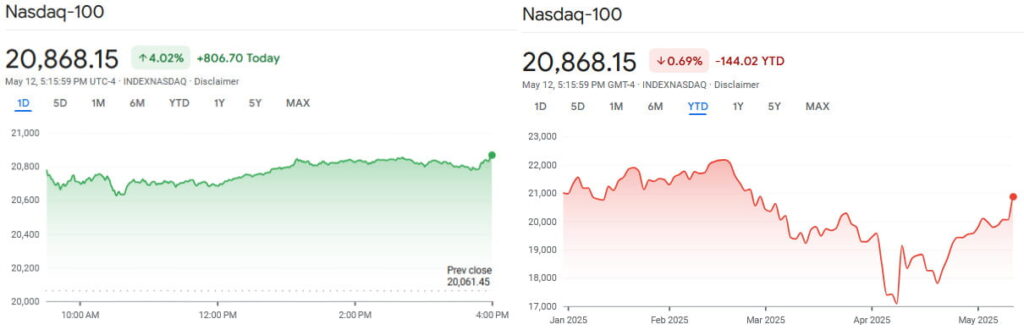
The tech-heavy NASDAQ-100 (NDX) index, which tracks the performance of the 100 largest non-financial companies on the exchange, has broken through a key resistance level, and could soon reclaim levels last seen in February.
As of press time on May 13, the index stood at 20,868. NDX has rallied by 4.02% in the last 24 hours on the back of the ongoing detente in the U.S. – China trade war. Despite an apparent recovery, the index remains down 0.69% on a year-to-date (YTD) basis.
NASDAQ-100 rise above moving average could start a rally to 22,000
On Monday, May 12, the index broke above its 200-period moving average (MA) on the daily timeframe, per renowned technical analyst TradingShot’s TradingView post made on the same day.
The last time this occurred was in early February of 2023, on the back of a recovery following the 2022 inflation crisis. Once the NASDAQ-100 moved above the moving average, it rose to meet the 1.382 Fibonacci extension — after which a short-term correction retested the moving average.
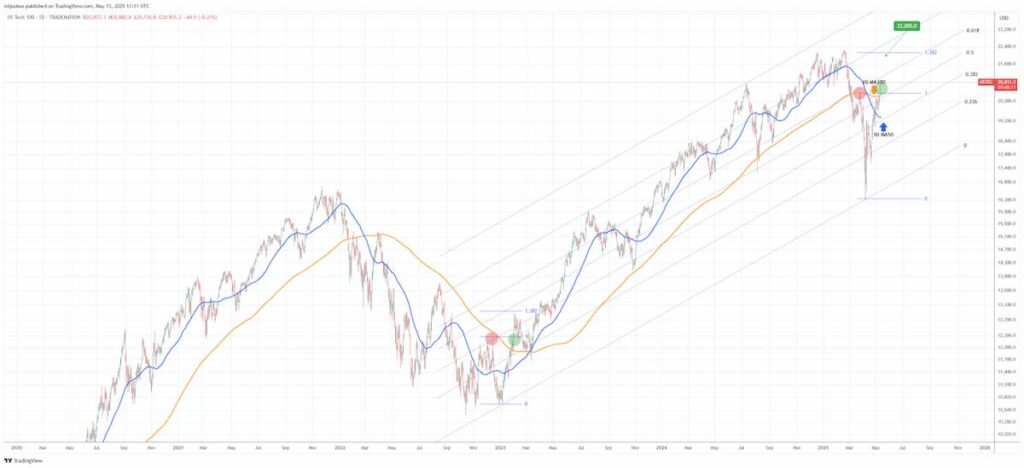
Fibonacci retracement uses historical price data to gauge the extent of price moves that occur after a pullback or consolidation. If an equivalent move happens now, it would see the NASDAQ-100 rise to 22,000 — within striking distance of its all-time high (ATH) of 22,175, reached on February 19.
Such a move would equate to a 5.42% rally — while the pattern involved a pullback the last time around, an uptrend resumed once the MA was unsuccessfully retested, so the signal represents an intriguing buying opportunity.
While major financial institutions like Goldman Sachs have warned that the effects of the tariff war might only become apparent in Q2 earnings, the stock market saw inflows of $2 trillion at the start of the week, and lessened trade tensions with China could easily stoke investor confidence going forward.
Featured image from Shutterstock