
XRP is likely to see further losses in the coming sessions as the asset’s whales signal potential selling pressure.
In this regard, on-chain data indicates that more than 31 million XRP tokens flowed into Binance in a single day, with the surge driven almost entirely by large holders, according to CryptoQuant data shared on February 24.

The spike in exchange inflows suggests whales may be preparing to sell, increasing the risk of renewed downside pressure that could push XRP below the key $1 level.
On February 21, XRP Ledger data showed deposits into the exchange exceeding 31 million XRP, driven almost entirely by wallets holding between 100,000 and 1 million XRP and over 1 million XRP. Retail participation was minimal, confirming the move was whale-led rather than broad-based.
In the preceding days, inflows were relatively subdued. February 15 and 17 saw limited activity, while February 16 recorded a moderate increase, largely from 1 million-plus XRP holders, still far below the February 21 spike. Activity briefly rose on February 18 before easing again on February 19 and 20, when the price hit a short-term low.
What’s next for XRP
Historically, sharp whale inflows to exchanges have preceded volatility, as large transfers often signal intent to sell. If even part of the 31 million-plus XRP is offloaded, it could amplify selling pressure while the asset struggles to reclaim higher levels.
This grim picture comes as XRP continues to trade in a volatile state, with recent losses tied to broader market sentiment led by Bitcoin (BTC).
Despite the price pressure, positive developments persist, including Ripple’s planned 2026 XRPL upgrades to enhance tokenized assets and institutional features, alongside recent institutional products such as Japan’s SBI Holdings issuing blockchain-based bonds with XRP rewards.
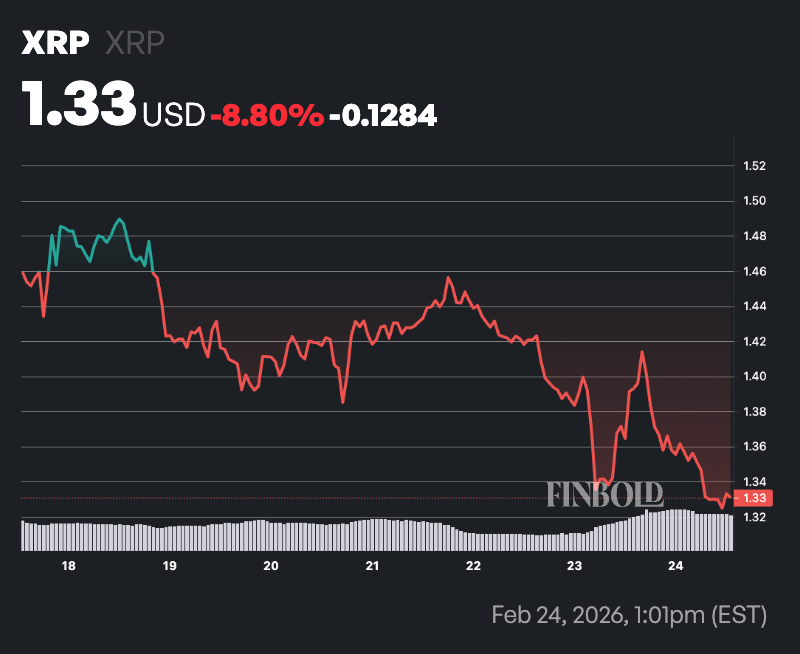
XRP price anaysis
As of press time, XRP was trading at $1.33, well below both its 50-day SMA ($1.75) and 200-day SMA ($2.29).
This positioning signals a clear bearish structure, considering that when price trades below the 50-day average, it reflects short- to medium-term weakness.
Sitting beneath the 200-day average reinforces a longer-term downtrend. The wide gap between the current price and both moving averages suggests sustained selling pressure rather than a brief pullback.
Meanwhile, the 14-day RSI stands at 36.85, which is in neutral territory but leaning toward oversold conditions. While it has not yet dipped below 30, it indicates weakening momentum and reduced buying strength.
Featured image via Shutterstock