
XRP may be setting up for a potential rally after flashing a key technical buy signal, placing the next possible target around $3.5.
On the four-hour chart, XRP perpetual contracts show the asset has been under pressure, sliding from above $3.10 earlier this week to lows near $2.98.
However, a TD Sequential buy signal has just appeared, a technical indicator that often precedes trend reversals after prolonged declines, as identified by analyst Ali Martinez in an X post on September 20.
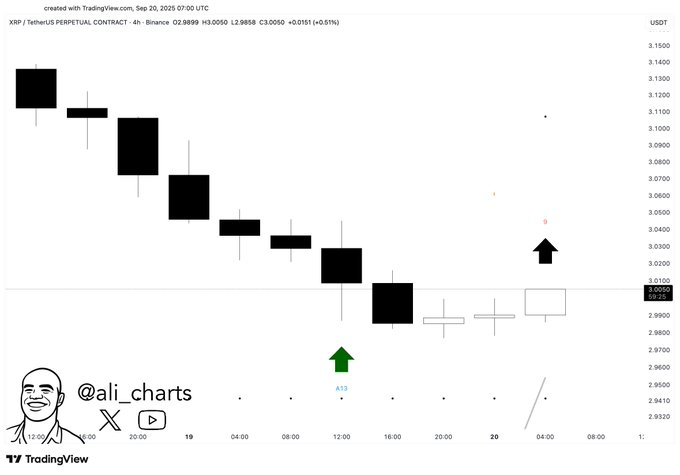
Notably, traders use the TD Sequential to spot potential exhaustion points in bearish or bullish moves, and in this case, it suggests the recent selling momentum may be losing steam, paving the way for a rebound.
Key XRP price levels to watch
If bullish momentum is sustainable, XRP could challenge resistance near $3.20 before targeting the $3.50 zone. A sustained close above $3.10 would further validate the bullish setup.
At the same time, traders are watching closely as broader cryptocurrency market conditions remain volatile. Failure to reclaim and hold the $3 psychological level could invalidate the bullish outlook, opening the door to deeper retracements.
At the same time, the improving technical picture comes as fundamentals turn more supportive. In this case, the newly launched REX-Osprey XRPR ETF, the first U.S. fund offering regulated exposure to XRP, saw $37.7 million in trading volume on debut, the strongest natural opening day for any crypto ETF in 2025.
Although the ETF does not hold XRP directly, instead using derivatives to mirror price movements, it provides a regulated channel for institutional investors to gain exposure.
Optimism is now building that broader Wall Street adoption of XRP could accelerate, especially with regulators set to rule on other spot XRP applications in October.
XRP price analysis
By press time, XRP was trading at $2.99, down less than 0.1% in the past 24 hours and over 2% on the weekly chart.
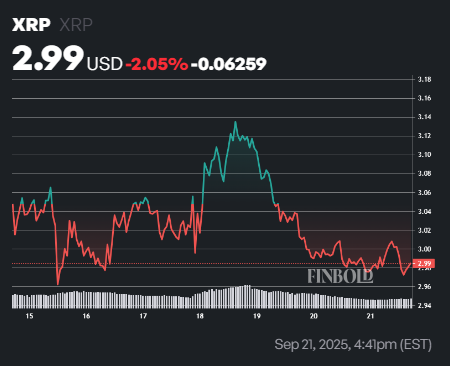
At current levels, XRP is almost aligned with its 50-day simple moving average (SMA) at $3, suggesting price consolidation around a short-term equilibrium. The 200-day SMA at $2.56 remains below the current price, reinforcing a broader bullish trend despite recent sideways action.
Meanwhile, the 14-day RSI stands at 49.61, sitting in the neutral zone and indicating neither overbought nor oversold conditions. This supports the view that XRP may be consolidating before its next significant move.
Featured image via Shutterstock