
As Bitcoin (BTC) consolidates below $60,000, a cryptocurrency trading expert has pointed out that the digital asset still has the potential to reach the coveted $100,000 valuation in the near term.
This projection is based on Bitcoin’s adherence to structural patterns similar to past cycles, which it has followed with remarkable precision. Notably, the analyst TradingShot, in a TradingView post on September 2, noted that the asset could reach new highs based on technical analysts and exterior catalysts.
One of the most critical aspects of the analysis is the one-week moving average (MA50), which has served as a strong support level during key moments in previous Bitcoin cycles. Notably, cryptocurrency’s price recently tested this level in early August and successfully held above it, aligning with historical patterns seen just before the asset entered a parabolic rally.
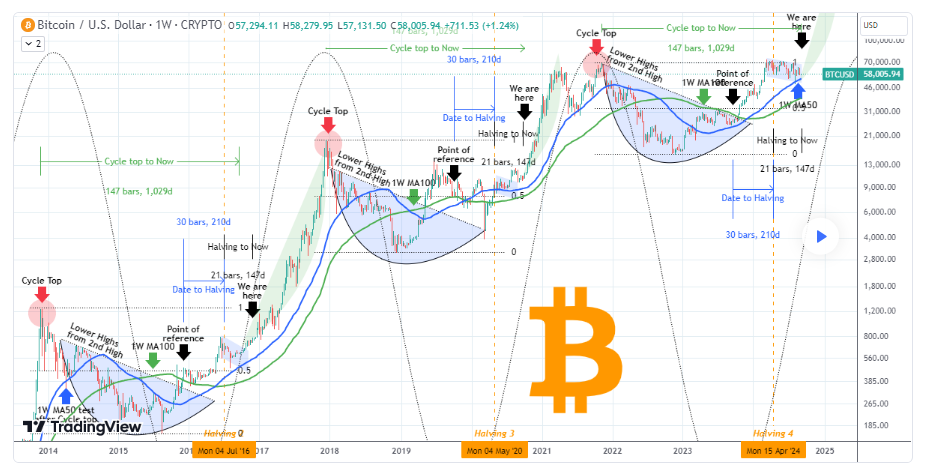
According to TradingShot, the 1W MA50 has held at this point in all previous cycles, 147 weeks (or 1,029 days) from the previous cycle top and 21 weeks (or 147 days) since the last halving event.
This timeframe has historically marked the start of an aggressive price rise. The analysis suggested that as long as Bitcoin maintains this support level, market psychology will remain bullish, making a breakout above $100,000 a strong possibility.
Bitcoin’s key external catalysts
Beyond technical indicators, the expert highlighted other key catalysts likely to help Bitcoin rally to $100,000. The expert pointed to the convergence of two significant upcoming economic events: the expected start of an interest rate cut cycle and the U.S. presidential elections in November 2024.
“If it holds, breaking above the 100k should be a minimum expectation, especially ahead of this month’s start of an Interest Rate Cut Cycle and the U.S. elections (traditionally markets are bullish post event) in November,” the expert noted.
Historically, Bitcoin has reacted positively to interest rate cuts, typically leading to a more favorable economic environment for risky assets like cryptocurrencies. Additionally, bullish market sentiment has traditionally followed U.S. elections, which could further fuel Bitcoin’s price rally.
Based on the analysis, I consider the projection above the $100,000 mark a plausible scenario for Bitcoin’s future price action. However, I believe that the existing macroeconomic conditions and recession fears are key factors that will likely steer Bitcoin toward the predicted level. While historical price movements are important, the current economic landscape might alter the trajectory.
Notably, bullish sentiment around the election could increase if Republican candidate Donald Trump is elected, as the ex-president has expressed support for the crypto space.
In the short term, on-chain data indicates that Bitcoin investors should remain cautious regarding the asset’s next steps.
For instance, data shared by cryptocurrency analyst Ali Martinez in an X post on September 1 indicated that capital flows for major assets like Bitcoin dropped below those for stablecoins, signaling increased caution among investors.
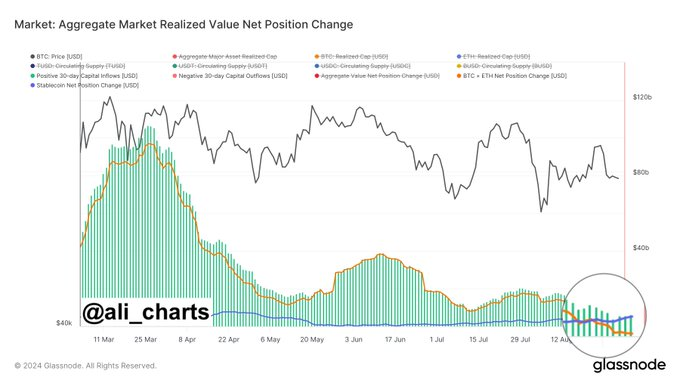
This shift points to a defensive stance in the market, where investors opt for the relative safety of stablecoins over the volatility of major cryptocurrencies.
Notably, the seemingly cautious market approach comes amid projections that Bitcoin will likely crash below $50,000. As reported by Finbold, analyst Alan Santana predicted that Bitcoin could drop to $38,000, noting that the asset’s moving average shows an “ultra-bearish” signal.
Bitcoin price analysis
As of press time, Bitcoin was trading at $58,410, having made modest gains of about 0.7% in the last 24 hours. On the weekly timeframe, BTC has plunged over 8%.
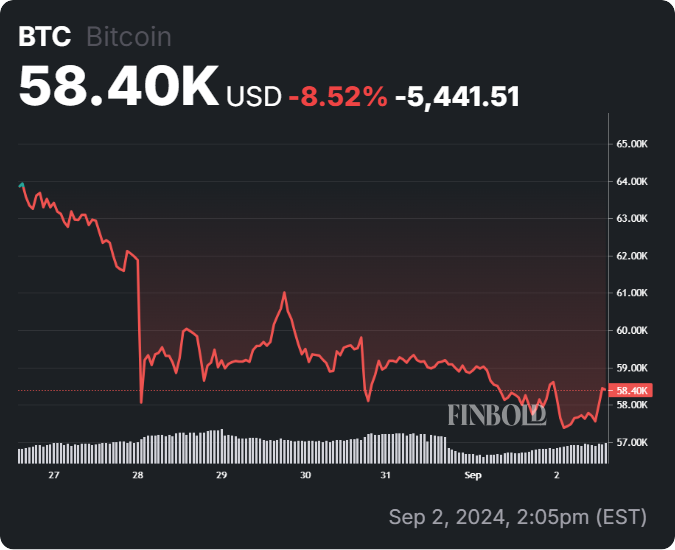
In summary, Bitcoin’s price has been on a downward trajectory over the past week, with a particularly sharp decline around August 28. Following this dip, the market remained quite volatile, with Bitcoin fluctuating between $56,000 and $60,000.
However, the 24-hour trading volume has surged 78%. This notable rise in trading activity suggests heightened buyer and seller engagement, likely in response to recent price movements. Overall, investors should pay attention to the $60,000 resistance zone, as breaching this level could validate bullish sentiments.
Disclaimer: The content on this site should not be considered investment advice. Investing is speculative. When investing, your capital is at risk.