
Bitcoin’s (BTC) bullish ‘Uptober’ reputation was shattered this year after the cryptocurrency ended October with a nearly 4% loss, marking its worst October performance since 2014.
Now, according to cryptocurrency analyst and TradingView contributor TradingShot, the weak monthly close may signal the start of a deeper correction, potentially sending Bitcoin toward the $87,000 region in the weeks ahead.
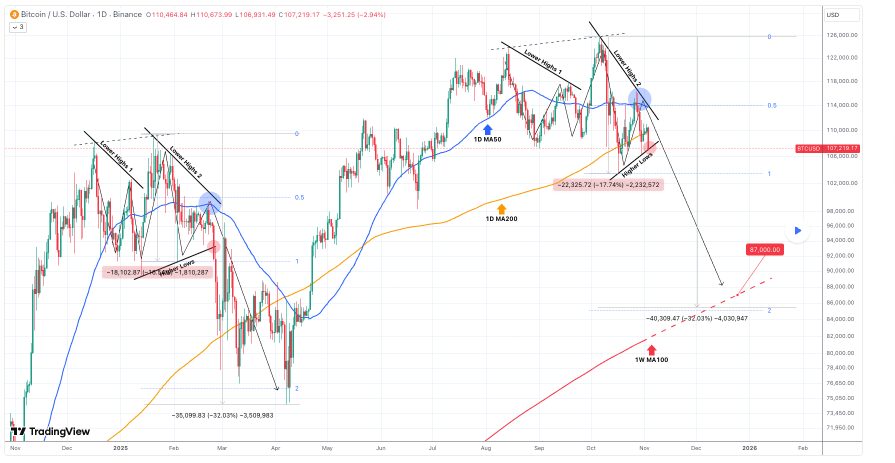
The analyst pointed to a fractal pattern mirroring Bitcoin’s price action between December 2024 and February 2025. During that period, BTC rejected a descending trendline, lost its higher-lows support structure, and ultimately fell roughly 32% from its all-time high.
The recent move, marked by a rejection at the 1-day 50-day moving average (MA), resistance on a descending highs trendline, and stalling at the 0.5 Fibonacci retracement, closely resembles that earlier setup.
Notably, since mid-August, Bitcoin has made a series of lower highs, with the latest rejection occurring at the same key moving average that capped price rallies during the previous fractal cycle.
A symmetrical breakdown similar to early 2025 could see Bitcoin slide another 32%, aligning with the 2.0 Fibonacci extension and converging near the weekly 100-day moving average.
That technical confluence places a target around $87,000, a level the analyst said may act as a critical demand zone if the market follows the same pattern.
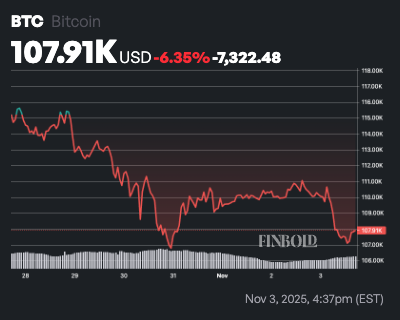
Indeed, this warning comes as Bitcoin extended its losses into November, failing to reclaim the $110,000 resistance. The asset has been weighed by concerns over a possible Federal Reserve rate cut in December, which now seems uncertain, leaving investors uneasy.
At the same time, the market has failed to respond to recent positive news regarding the trade negotiations between the United States and China.
Bitcoin price analysis
As of press time, Bitcoin was trading at $107,632, down nearly 3% in the past 24 hours and 6.6% on the weekly timeframe.
At the current price, Bitcoin’s 50-day simple moving average (SMA) of $114,139 now acts as overhead resistance, while the 200-day SMA ($105,876) provides immediate support just $1,800 below spot.
Price sits in the classic “bullish continuation” pocket, above the long-term average yet below the medium-term one, suggesting buyers remain in control as long as the 200-day holds.
Meanwhile, the 14-day Relative Strength Index (RSI) at 47.79 is neutral, neither overbought nor oversold. This quiet momentum reading gives the current rally room to accelerate without immediate mean-reversion risk.
Featured image via Shutterstock