
Amazon (NASDAQ: AMZN) has experienced growth in 2024 — but it has been far from smooth and uneventful. While AMZN’s share price has appreciated, inflation, supply chain issues, and regulatory scrutiny, as well as increased competition, have served to limit the rally.
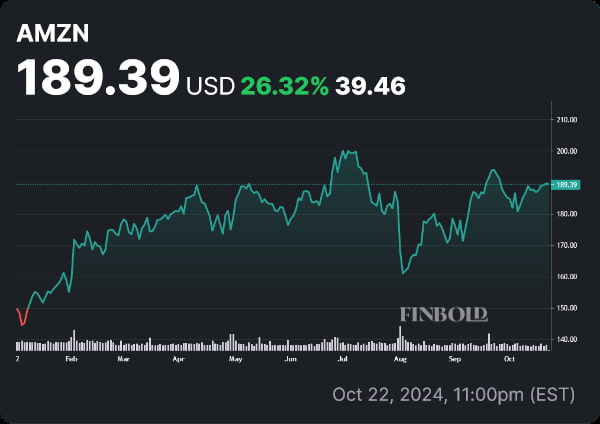
In July and August, the stock experienced a significant 19.5% crash — dropping from an all-time high of $200 on July 2 down to $161 on August 4. Since then, the online retail leader has been on a steady road of recovery — at press time, AMZN shares are trading at $189.39, having rallied by 26.32% year-to-date (YTD).
Although decent, these results can’t compare to other big-name tech companies. With the company’s next earnings report just a week away, one technical analyst has highlighted a very bullish chart pattern — hinting that AMZN stock price could reach as high as $310.
AMZN is in a multi-year cup and handle pattern
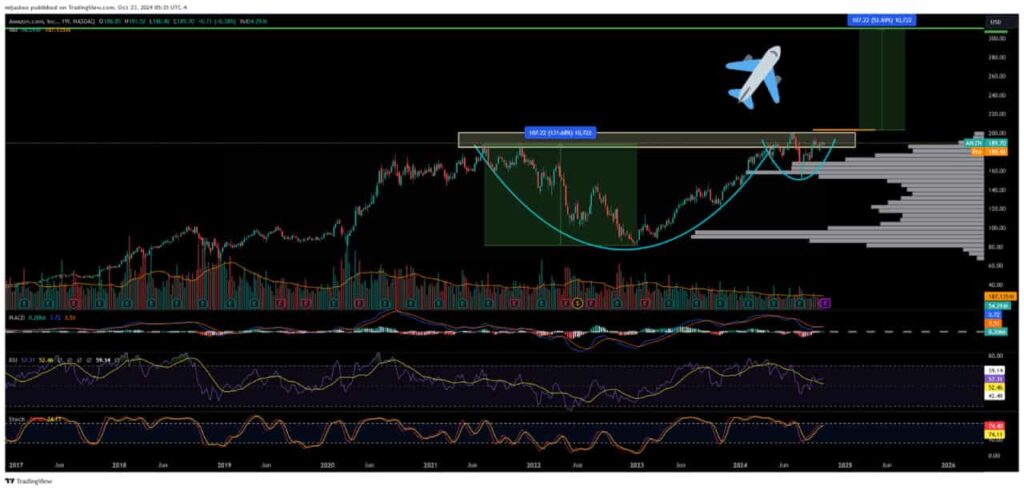
Starting from early June of 2021, the tech behemoth’s stock started forming a ‘cup and handle’ pattern, as spotted by veteran trader and analyst RonnieV29. The pattern is relatively rare but simple to understand — it’s a bullish pattern that can hint at a breakout to the upside that continues an uptrend.
After the stock price hits a high, it retraces down to a point — forming the bottom of the ‘cup’. Then, it rises until the previous high is matched — at this point, a slight pullback, in the shape of a handle occurs.
If that pullback is followed by a breakout, the pattern is confirmed — price targets are set by taking the depth of the ‘cup’ and adding it to the breakout level.
At press time, the ‘handle’ has already been formed — the only thing left to do is wait for the breakout.
If RonnieV29’s analysis is correct, the stock could reach as high as $310, which would represent a 63.68% increase compared to the current AMZN share price — pushing the company over a $3 trillion market cap.
This is quite a bullish thesis — the average price target set by Wall Street equity researchers is just $224, while advanced AI models such as ChatGPT-4o and Gemini project prices of $225 and $200.
Is the Amazon cup and handle pattern legitimate?
The ‘cup and handle’ is simple enough to spot on account of its shape, but not every instance of price action that looks like a ‘cup and handle’ is legitimate.
There are various methods used to determine the legitimacy of a pattern. A ‘cup and handle’ is a long-term occurrence — taking at least seven weeks to form, although it can easily stretch to a multi-year period.
One crucial thing to note is that the ‘handle’ has not retraced more than a third into the ‘cup’ — which is a promising sign. However, there are a couple of worrying signs — volume has been lagging as we enter the ‘handle’ part of the pattern, and has dropped even further as we reach the breakout.
Ultimately, only the next few trading sessions will reveal whether or not a breakout is in the works — For now, the chances of a breakout on such low volume seem slim.