Despite a recent setback, which has seen the stock price of Advanced Micro Devices (NASDAQ: AMD) slow down its previous gains and even make a minor decline across the past couple of days, the American semiconductor behemoth is recording a massively successful year.
Specifically, during 2023, AMD has managed to climb from the price range below $80 to $145 by the year’s end, recording a growth of over 80%, as well as adding another increase of more than 80% after that, and ending up in the current $175 range, as per chart data on February 20.
Considering its historical price movements and the fact that AMD has recently hit its all-time high (ATH) of $185, market participants are rightfully wondering whether this is the top – how much longer is the bullish momentum going to last, and whether it is a buy, sell, or hold stock for the rest of 2024.
AMD is a ‘strong buy’
According to a consensus of 34 Wall Street analysts who have shared their expectations for AMD over the previous three months, the technology giant’s stock is a ‘strong buy’ for the next 12 months, based on 29 of them recommending a ‘buy,’ five voting for a ‘hold,’ and no ‘sell’ calls, with an average price target at $194.77.
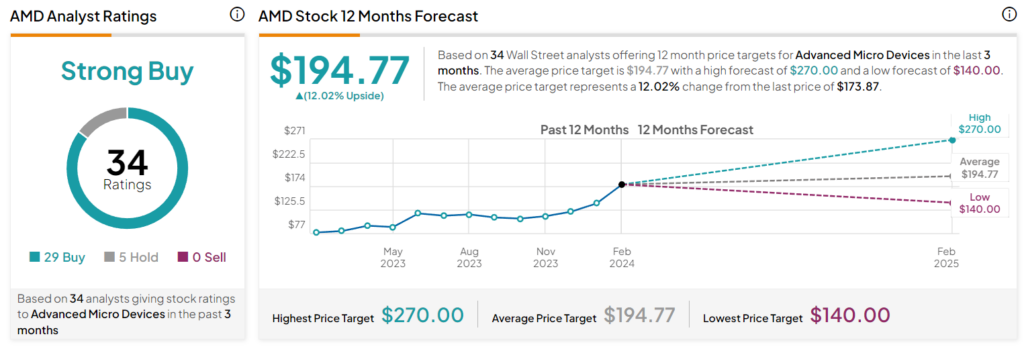
As it happens, the analysts’ bullish attitude and recent price hikes coincide with the renewed hype around artificial intelligence (AI), which has transformed the semiconductor industry and sent the prices of many stocks in related industries sky-high – including that of AMD.
Moreover, AMD is diversifying its integration efforts and leveraging chipset-based graphics processing units (GPUs) with differentiated price-to-performance ratios and gaining market share from Nvidia (NASDAQ: NVDA) while consistently expanding its presence in AI-powered computing.
AMD stock price analysis
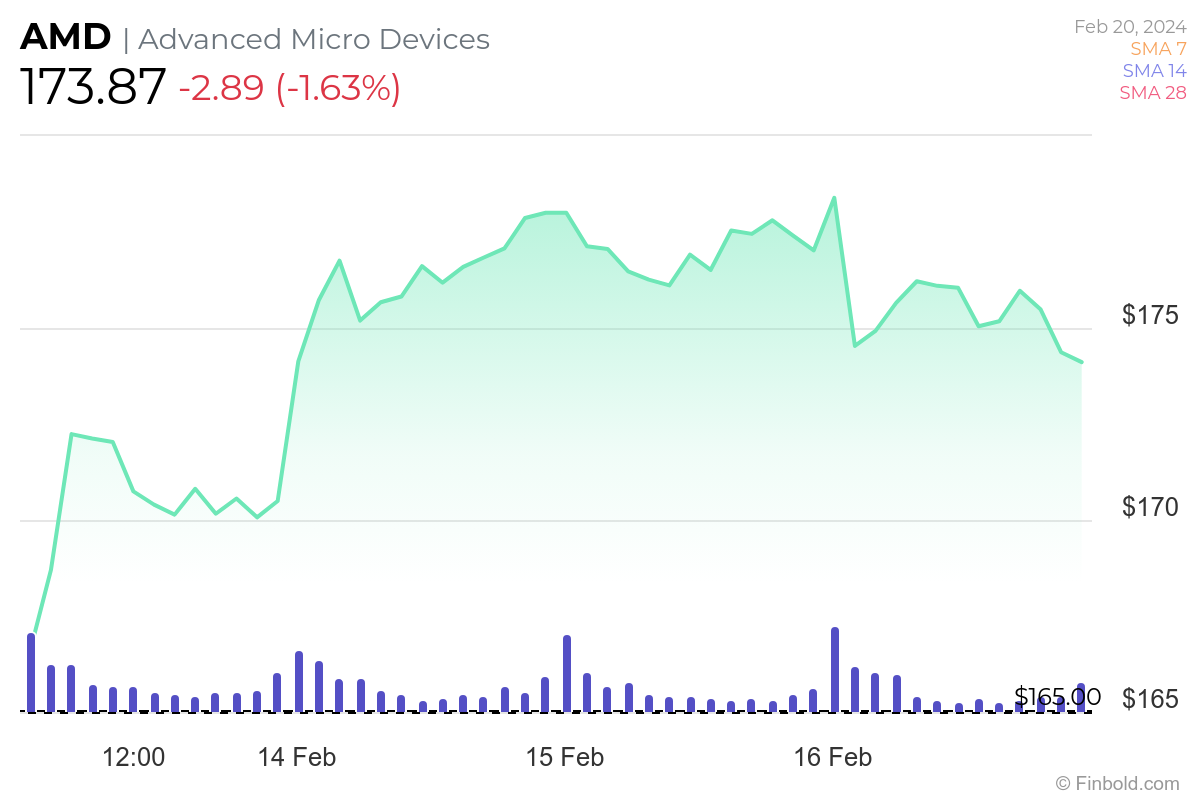
As things stand, the price of AMD shares currently amounts to $173.87, recording a decrease of 1.63% on the day but nonetheless gaining 0.74% across the previous week and advancing 3.38% over the past month, with an increase of 126.48% on its yearly chart.
In conclusion, AMD is currently demonstrating strength in the stock market, recording positive trends in both its short-term and long-term charts, outperforming 96% of all stocks in the market in its yearly performance, as well as doing better than 96% of other stocks in the semiconductor business.
Finally, other bullish signs include AMD presently trading in the middle of its last-month price range between $162.56 and $184.92, as well as observing a healthy liquidity of over 77 million traded shares per day.
Buy stocks now with eToro – trusted and advanced investment platform
Disclaimer: The content on this site should not be considered investment advice. Investing is speculative. When investing, your capital is at risk.