
Some traders take a patient approach, playing the long game and unconcerned with immediate changes, while others prefer dynamic, short-term strategies for quick profits.
In the case of Advanced Micro Devices (NASDAQ: AMD) stock, a strategy involving entering a position when a bullish moving average convergence/divergence (MACD) cross occurs and exiting when a bearish MACD cross appears has yielded a remarkable 123% return over the past three years, compared to an 85% return with a simple buy and hold strategy.
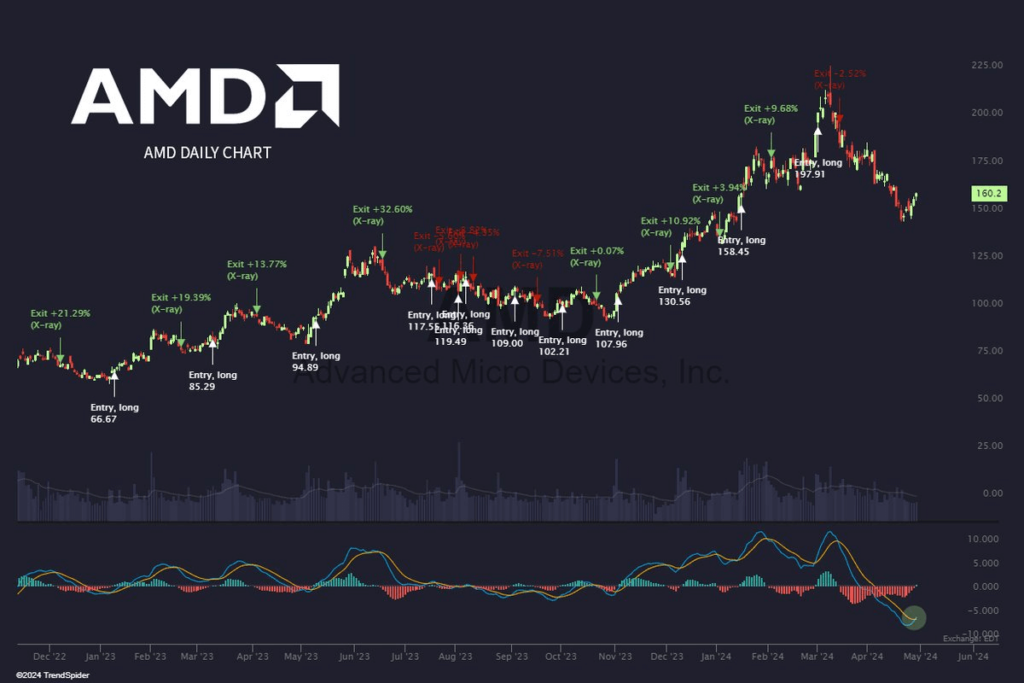
With the first bullish cross since February forming and earnings scheduled to be reported on April 30 after markets close, this position could be very profitable if earnings exceed expectations set at $0.61 in EPS and $5.5 billion in revenues.
After adding a healthy 1.78% in the latest trading session, AMD stock is trading at a price of $160.20.
How to set up MACD cross strategy?
Establishing the MACD crossover strategy is quite straightforward: traders enter into position when the MACD line crosses above the signal line and exit when it falls below this line.
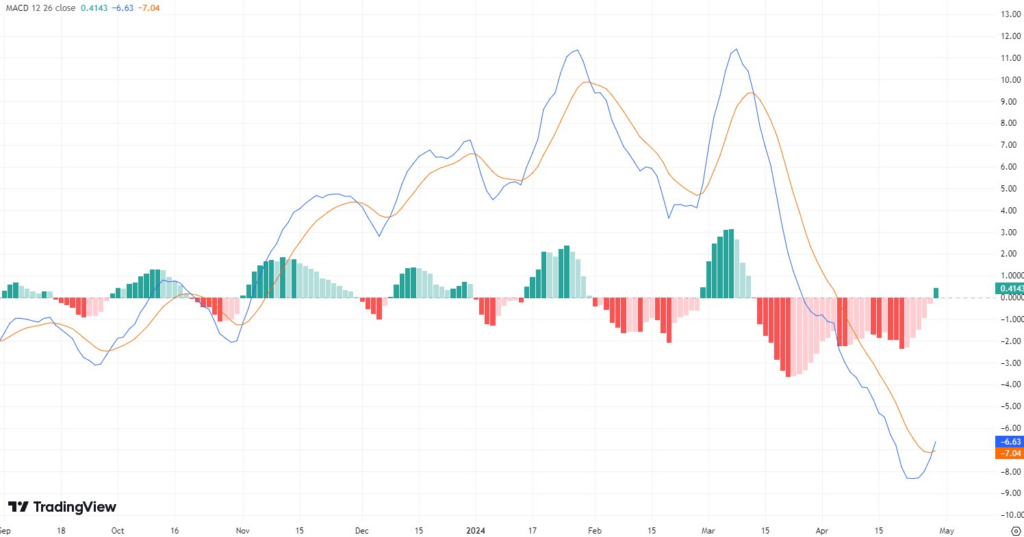
It’s best to avoid trading with this strategy if the MACD line crosses the signal line frequently in a short span. This signals high volatility and raises the risk of investment losses.
Another handy tool is the MACD histogram, which helps forecast line movements and anticipate potential surges or dips in the MACD line.
What do other indicators tell about AMD stock?
The Relative Strength Index (RSI) for AMD stock is ‘Neutral’ at 44.54 but trending upward toward the overbought zone above 70.
Bollinger Bands contribute to the bearish sentiment around the stock, as AMD shares trade within the lower band. However, akin to the MACD, there are signs that the stock price is poised to break out toward the upper bullish band, potentially signaling positive market momentum.
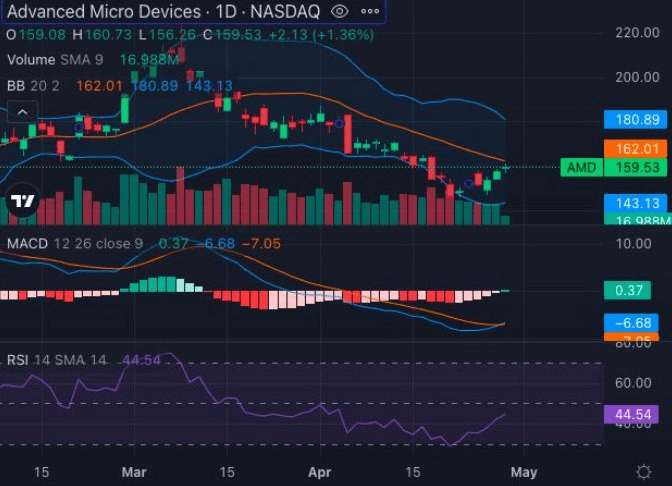
Overall, the technical setup for AMD stock appears predominantly bearish. Nonetheless, there are indications of buying pressure potential crossovers in the MACD and Bollinger Bands, especially as AMD approaches its Q1 earnings announcement.
Buy stocks now with eToro – trusted and advanced investment platform
Disclaimer: The content on this site should not be considered investment advice. Investing is speculative. When investing, your capital is at risk.