The following guide will examine the moving average convergence divergence (MACD), what it is and what it measures, how to understand the indicator on charts and interpret those findings, as well as the pros and cons of using this technical analysis tool.
Best Crypto Exchange for Intermediate Traders and Investors
-
Invest in cryptocurrencies and 3,000+ other assets including stocks and precious metals.
-
0% commission on stocks - buy in bulk or just a fraction from as little as $10. Other fees apply. For more information, visit etoro.com/trading/fees.
-
Copy top-performing traders in real time, automatically.
-
eToro USA is registered with FINRA for securities trading.
What is the MACD indicator?
Because the MACD indicator tracks past pricing data, it falls into the lagging indicator category. Therefore, the MACD is less useful for stocks that are not trending (trading in a range) or are trading with unpredictable price action. Nevertheless, the indicator can demonstrate whether the bullish or bearish movement in the price is strengthening or weakening and help spot entry and exit points for trades.
Traders may interpret the MACD indicator in various ways, but the more common techniques are crossovers, divergences, and rapid rises/falls.
Beginner’s corner:
- What is Investing? Putting Money to Work
- 17 Common Investing Mistakes to Avoid
- 15 Top-Rated Investment Books of All Time
- How to Buy Stocks? Complete Beginner’s Guide
- 10 Best Stock Trading Books for Beginners
- 15 Highest-Rated Crypto Books for Beginners
- 6 Basic Rules of Investing
- Dividend Investing for Beginners
- Top 6 Real Estate Investing Books for Beginners
- 5 Passive Income Investment Ideas
MACD indicator terminology
Key terms to understand as we move on with the guide:
- Moving Average: A technical indicator that refers to an average for a particular trading instrument over a specified period;
- Exponential moving average/exponentially weighted moving: A moving average that gives greater importance to the most recent data points;
- Convergence: A trading indicator that is evidenced by the two moving averages coming towards each other;
- Divergence: A trading indicator that is evidenced by the two moving averages drifting apart.
MACD indicator explained
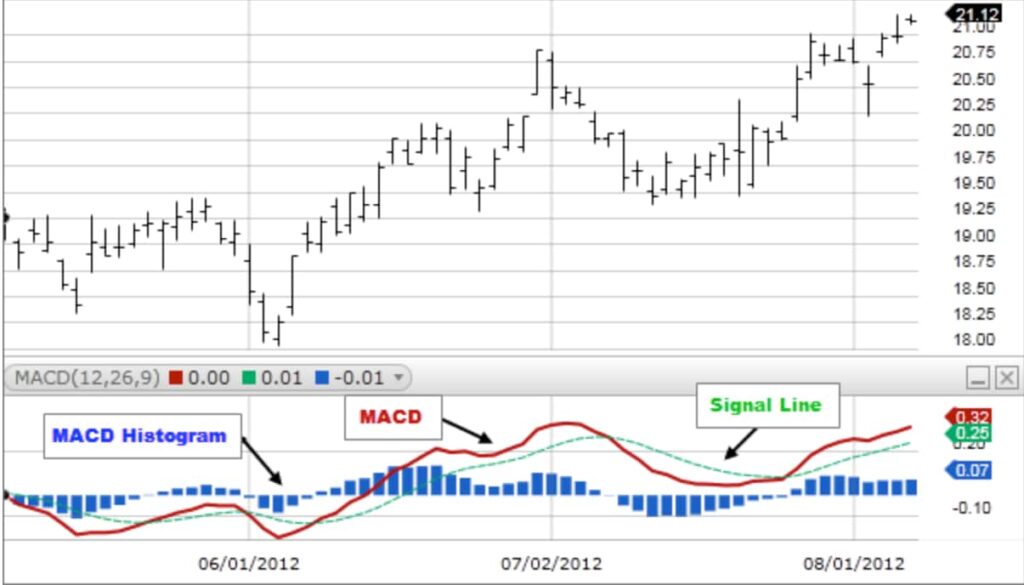
The MACD indicator consists of three components:
- The MACD line: The main MACD line is generated by subtracting the longer moving average (26-period) from the shorter one (12-period). The MACD line helps determine upward or downward momentum, i.e., market trend;
- The signal line: The signal line is the EMA (typically 9-period) of the MACD itself. The MACD generates a buy signal when it moves above its own nine-day EMA and sends a sell signal when it moves below its nine-day EMA.
- Histogram: The histogram is the graphical representation of the divergence and convergence of the MACD line and the signal line, i.e., the distance between the two. When the MACD is above the signal line, the histogram is positive; it is negative when the MACD is below the signal line. If prices rise, the histogram grows bigger as the speed of the price movement accelerates and shrinks as the price movement decelerates. The same principle works in reverse if prices fall. Traders use the MACD’s histogram to measure momentum because it responds to the speed of price movement.
How is MACD calculated?
While 12, 26, and 9 are the typical value settings used with the MACD, traders can opt for other values depending on their trading style and goals.
The MACD line formula:
MACD line = 12-day EMA – 26-day EMA
Assuming the standard time ranges, the MACD is calculated by subtracting the value of a 26-period exponential moving average from a 12-period EMA. Both moving averages use closing prices of the period that is measured.
The MACD signal line formula:
Signal line = 9-day EMA of MACD line
The signal line is the 9-day EMA of the MACD line itself. Although not consistently accurate, the combined analysis of the signal line with the MACD line may help spot potential reversals or entry and exit points, especially when they happen at the extremities of the MACD chart (far above or far below the zero line).
The MACD histogram formula:
MACD histogram = MACD line – signal line
The MACD histogram illustrates the difference between MACD and the signal line. It is calculated by subtracting one from the other. The histogram is made of a bar graph, making it visually easier to read and interpret.
How to use the MACD indicator?
MACD helps reveal subtle shifts in the strength and direction of an asset’s trend, guiding traders on when to enter or exit a position. The indicator can be interpreted in several ways, but the more common methods are crossovers, rapid rises/falls, and divergences.
Recommended video: MACD indicator explained
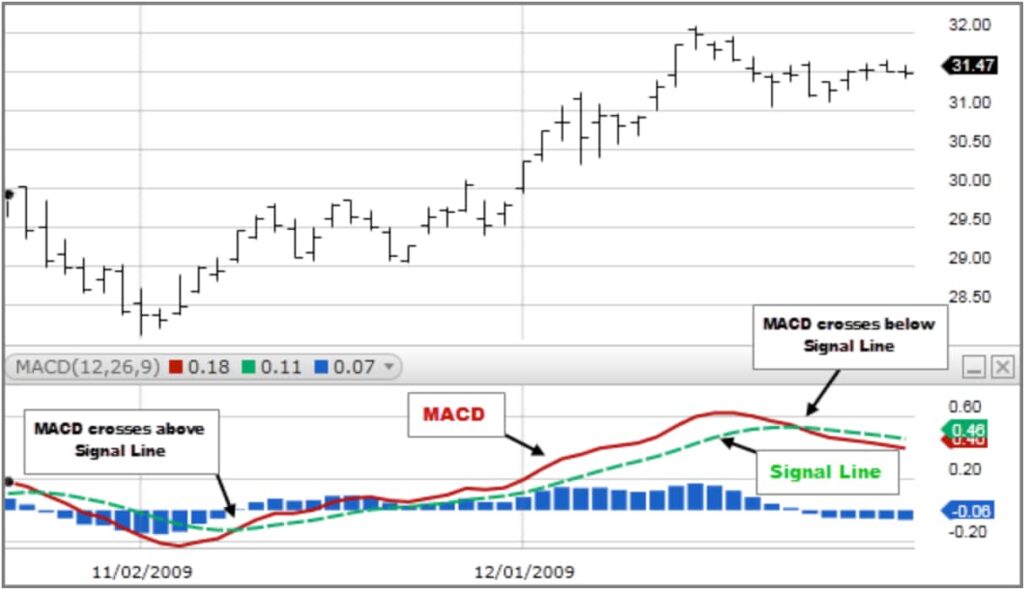
MACD signal line crossover
Signal line crossovers are the most typical MACD signals. A bullish crossover happens when the MACD line crosses above the signal line signifying an entry point for traders (buy opportunity). Conversely, a bearish crossover occurs when the MACD line crosses below the signal line presenting as an exit point (sell opportunity). Crossovers can last a few days or weeks, depending on the movement’s strength.
So, while the signal crossovers can be helpful, they are not always reliable. Therefore, it is also worth considering where they occur in the chart to minimize the risks. For instance, some traders wait for a confirmed cross above the signal line to avoid entering a position too early.
Namely, if the crossover indicates an entry point, but the MACD line indicator is below the zero line (negative), market conditions are still likely to be bearish. On the other hand, if a signal line crossover suggests a potential exit, but the MACD line indicator is above the zero line (positive), market conditions may still be observed to be bullish.
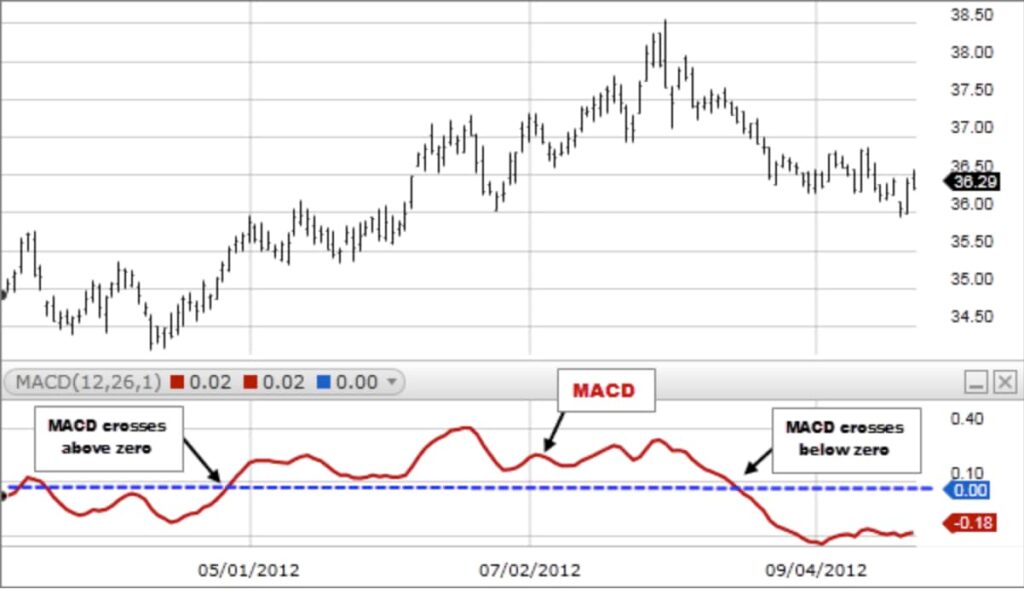
Centerline crossovers
Centerline crossover patterns are similar to signal line crossover patterns except that they involve only the MACD line and its relationship to the zero/center line.
When the MACD line crosses above the centerline, it is considered a bullish signal. Conversely, a fall below the center is a bearish signal. Additionally, it is considered bullish when the MACD line turns up from below zero, while a turn down from above zero is considered bearish.
MACD rapid rises or falls
The MACD rapid rises or falls occur when the underlying short-term moving average pulls away from the long-term moving average and may signal an overbought or oversold condition. But, because the MACD is a lagging indicator, traders typically compare this analysis with additional technical indicators like the Relative Strength Index (RSI) to verify if the overbought or oversold conditions.
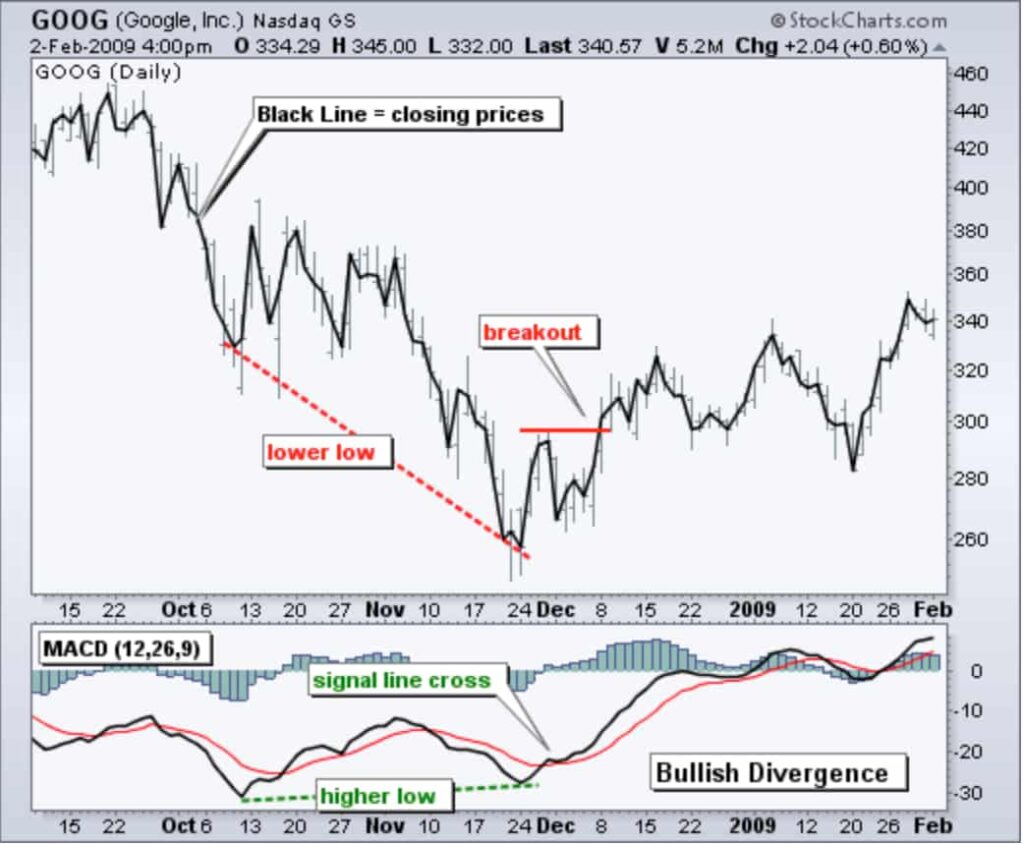
MACD divergence
A divergence occurs when the MACD forms highs or lows that diverge from the corresponding highs and lows in the underlying asset’s price.
Bullish divergence happens when the MACD forms two rising lows that align with two falling lows on the asset’s price, suggesting that the buying pressure is stronger despite the fall in price. Bullish divergences tend to lead to price reversals, possibly signaling a change in the trend.
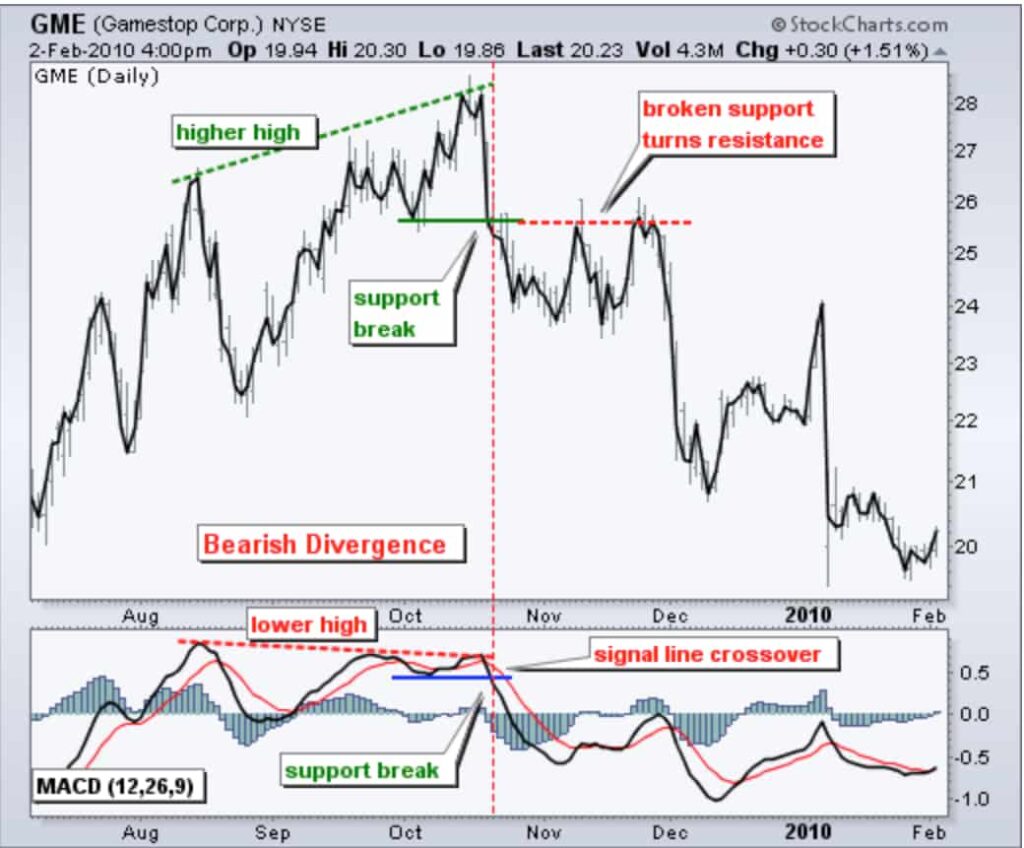
On the other hand, a bearish divergence occurs when the MACD forms two falling highs that correspond with two rising highs on the security’s price, signaling that despite price growth, buying pressure is not as strong as it was. Bearish divergences during long-term bullish trends (not as reliable during bearish trends) can indicate weakness in the trend.
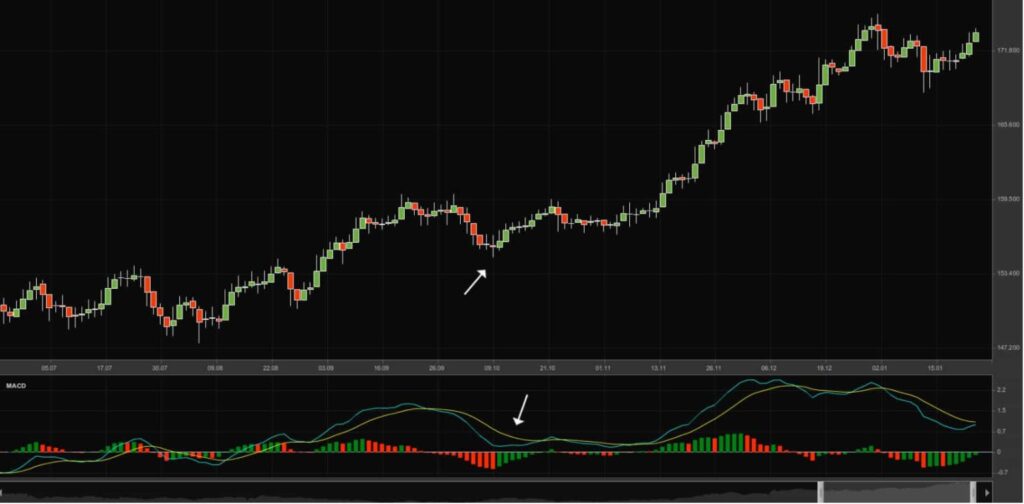
Divergence fakeout
There are several problems with trading divergences. Firstly, divergence can often signal a false positive, i.e., a possible reversal, but no actual reversal occurs. This is because prices often demonstrate a few surges or plunges as market participants set off stops to match the supply and demand in the order flow. Secondly, divergence doesn’t forecast all reversals, i.e., it predicts too many reversals that don’t occur and not enough real price reversals.
Indeed, using a divergence signal as a forecasting tool can be relatively unreliable. A divergence trade is not as error-free as it appears in hindsight since past data will only include successful divergence signals. Therefore, visual inspection of past chart data won’t give any insight into failed divergences since they no longer appear as a divergence.
One reason traders frequently lose with this setup is that they enter a position on a signal from the MACD but exit it based on the movement in price. Remember, price is the ultimate indicator, with momentum indicators (the MACD histogram is a price derivative and not the price itself) only manipulating price data. Therefore, it is recommended to use price action to assist with trading decisions when using the MACD.
Let’s look at some critical guidelines for doing so:
- Expect divergence on the MACD when the price action slows (relative to earlier price movements) or moves sideways, bearing in mind this isn’t necessarily an indication of a reversal;
- If divergence is detected, don’t exit a position only because of the divergence. Again, divergence isn’t a slid timing indicator and may not result in a reversal;
- Confirm divergence by waiting for the price to break the current trend before entering a divergence-based position. For example, if an uptrend shows bearish divergence, only exit once the price has broken out of the uptrend and entered a downtrend;
- Trust price action more than divergence. Take notice of the price breaking out of a prior trend, even if divergence wasn’t present at the time of the reversal.
Remember, divergence is an imperfect tool that may provide beneficial insight into some trades but not others. Therefore, it is essential to understand its weaknesses, as well as compensate for its shortcomings by analyzing price action.
Best Crypto Exchange for Intermediate Traders and Investors
-
Invest in cryptocurrencies and 3,000+ other assets including stocks and precious metals.
-
0% commission on stocks - buy in bulk or just a fraction from as little as $10. Other fees apply. For more information, visit etoro.com/trading/fees.
-
Copy top-performing traders in real time, automatically.
-
eToro USA is registered with FINRA for securities trading.
Pros and cons of the MACD indicator
Like most other technical analysis tools, the MACD indicator also comes with its own distinct advantages and disadvantages. To fully harness this momentum and trend indicator to its maximum capability, it’s essential to understand where it triumphs and where it can fall short.

Pros
- It can be used as a trend or a momentum indicator;
- The indicator helps to detect potential buy and sell signals through the MACD crossover and divergence;
- Useful as a stand-alone tool or in tandem with other technical indicators.

Cons
- MACD divergence can indicate possible reversals that never happen, i.e., it produces a false positive;
- Divergence doesn’t predict enough real price reversals;
- It cannot fully indicate whether an asset is overbought or oversold.
Verifying the MACD indicator
Sometimes it can happen that MACD isn’t a reliable trading signal, and one can’t automatically assume that divergence absolutely confirms it. Double checking, several reverses are preceded by divergence or don’t result in a reversal after all.
One of the divergence problems is that it can signal a reversal, but it is a false positive. The other is that the indicator won’t forecast all of them. To avoid unreliable signals, use MACD with momentum indicators and price actions to guide your trading decisions.
In conclusion
Finally, the MACD indicator is one of the most valuable technical analysis tools, identifying both market trends and momentum. As a result, it can assist in determining trend reversals and defining potential entry and exit points for your deals.
However, like with most technical indicators, the MACD is not always accurate and may provide numerous false and misleading signals, particularly during weak-trending or sideways price action. Therefore, to mitigate risk and confirm the signals further, traders should use the MACD in tandem with additional indicators, such as the RSI indicator.
Disclaimer: The content on this site should not be considered investment advice. Investing is speculative. When investing, your capital is at risk.
FAQs about the MACD indicator
What is the MACD indicator?
The moving average convergence divergence (MACD) is a technical indicator that shows the relationship between two moving averages of an asset’s price. Its purpose is to reveal changes in a trend’s direction, strength, momentum, and duration in the underlying security’s price.
How is MACD calculated?
The MACD is calculated by subtracting the value of a long-period exponential moving average (EMA) from a short-period EMA. Both moving averages use closing prices of the period that is measured.
What is the best MACD indicator setting?
The best settings for the MACD indicator generally depend on the trader’s strategy and market conditions. However, the most commonly used default settings are 12, 26, and 9, i.e., the shorter exponential moving average is taken over 12 time periods, the longer over 26 time periods, and the signal line is calculated from a 9-period.
What is the MACD histogram?
A MACD histogram is a graph representing the distance between the MACD and the signal line, i.e., the divergence and convergence between the two. The histogram helps traders identify momentum in the trend.
What's the difference between the MACD vs RSI indicators?
The MACD and RSI are both trend-following momentum indicators often used in tandem to give analysts and traders a better technical understanding of market conditions. While the MACD measures the relationship between two moving averages, the RSI measures price change in relation to recent price levels.
How does MACD indicate divergence?
A divergence ensues when the MACD forms highs or lows that diverge from the corresponding highs and lows in the underlying security’s price. For example, a bullish divergence happens when the MACD forms two rising lows that align with two falling lows on the asset’s price. Conversely, a bearish divergence occurs when the MACD forms two falling highs that line up with two rising highs in the price.
What's a common MACD indicator strategy for traders?
A prevalent MACD indicator strategy involves observing crossovers, overbought/oversold conditions, and divergences. When the MACD line crosses above the signal line, it’s seen as a bullish sign, indicating a potential buy opportunity. Conversely, when the MACD line crosses below the signal line, it might be time to sell. Additionally, if the MACD rises/falls to extreme levels, it can signify overbought or oversold conditions. Divergence between MACD and price movements can also indicate potential reversals.
What are the limitations of the MACD?
One of the primary problems with MACD divergence is that it can frequently signal a possible reversal, but no actual reversal occurs, meaning it produces a false positive. Additionally, divergence cannot forecast all reversals. Ultimately, it seems to predict too many reversals that don’t occur and not an adequate amount of actual price reversals.
What is the basic MACD indicator formula?
The MACD indicator formula comprises three main components:
- MACD Line: Difference between the 12-day EMA and the 26-day EMA;
- Signal Line: 9-day EMA of the MACD Line;
- MACD Histogram: Difference between the MACD Line and the Signal Line.
By monitoring the intersections and distances between these lines, traders can identify potential buy and sell signals.
How can the MACD indicator be used to gauge Bitcoin's price trends?
A potential uptrend for Bitcoin may be signaled when the MACD line surpasses the signal line. Conversely, a possible downtrend is indicated when the MACD line falls below the signal line.
What is the Impulse MACD indicator?
The Impulse MACD Indicator is a technical analysis tool, designed to filter out noise and focus on significant trend changes. The Impulse MACD typically modifies the MACD by applying a color code to the MACD histogram bars, where different colors indicate buying or selling impulses. This helps traders identify potential entry and exit points by highlighting changes in momentum more clearly than the standard MACD.
What is a good MACD value?
A “good” MACD value depends on context rather than a specific number. Generally, when the MACD line crosses above the signal line, it’s considered a bullish signal, and when it crosses below, it’s bearish. The distance between the MACD and signal lines can also indicate the strength of the trend.
Is MACD and RSI enough?
MACD and RSI together can provide strong insights into momentum and trend strength, but they may not be enough on their own. It’s often best to use them alongside other indicators and analysis methods for more reliable trading decisions.
How to confirm MACD signal?
To confirm a MACD signal, look for alignment with other indicators like RSI, check for strong volume, or observe if the MACD signal occurs at a key support or resistance level. Combining these factors increases the reliability of the signal.
Is MACD good for day trading?
Yes, MACD can be effective for day trading, as it helps identify short-term momentum and trend reversals. However, it works best when combined with other indicators and real-time analysis for more accurate decision-making.
Is there a better indicator than MACD?
There isn’t a single “better” indicator than MACD, as effectiveness depends on the trading strategy and market conditions. Some traders prefer other indicators like RSI for momentum or moving averages for trend analysis. Often, combining multiple indicators provides a more comprehensive view than relying on just one.
What is the best combination with MACD?
The best combination with MACD often includes RSI for momentum confirmation, moving averages for trend direction, and volume indicators for gauging market strength. Using these together can provide a well-rounded analysis for more reliable trading signals.
Best Crypto Exchange for Intermediate Traders and Investors
-
Invest in cryptocurrencies and 3,000+ other assets including stocks and precious metals.
-
0% commission on stocks - buy in bulk or just a fraction from as little as $10. Other fees apply. For more information, visit etoro.com/trading/fees.
-
Copy top-performing traders in real time, automatically.
-
eToro USA is registered with FINRA for securities trading.