
A stock market analyst has suggested that the S&P 500 index is poised to hit new highs, and inventors should anticipate a significant surge in the coming months.
Particularly, according to an analysis shared by Tradingshot on TradingView, the S&P 500 has shown remarkable resilience, recovering nearly all of its losses since the July 16 record high.
Once again, the index established itself firmly above the 1D MA50, a critical short-term support level during uptrends.
Picks for you
The expert highlighted the S&P 500’s performance, illustrating a clear “Channel Up” pattern that has dominated the market’s trajectory since September 2023. This pattern indicates a bullish trend, where each breakout above a previous resistance level is followed by a period of consolidation before the next upward move.
In recent history, the S&P 500 has consistently converted former resistance levels into new support, reinforcing the strength of the uptrend. For instance, past resistance levels turned into support in October 2023 and again in June 2024.
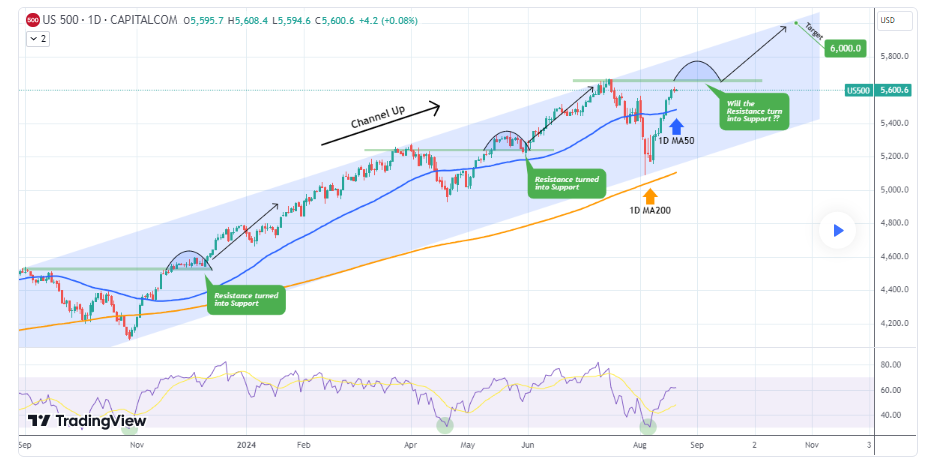
S&P 500’s timeline to 6000
Tradingshot’s analysis suggested that the S&P 500 will soon break above the 5670 level, a critical resistance point, and consolidate for one to two weeks, holding steady above this threshold. This consolidation phase is expected to set the stage for the next leg up, targeting a higher high of 6,000 by the end of October 2024.
The projection aligns with the long-term “Channel Up” pattern, which continues to guide the index’s upward trajectory. If the S&P 500 successfully breaks above 5670 and establishes this level as new support, it will likely pave the way for a continued bullish trend, potentially reaching the 6,000 mark as forecasted.
With the 1D MA50 providing consistent support and broader market sentiment remaining positive, the S&P 500’s path to 6,000 appears increasingly plausible.
S&P 500 resumes bullish trend
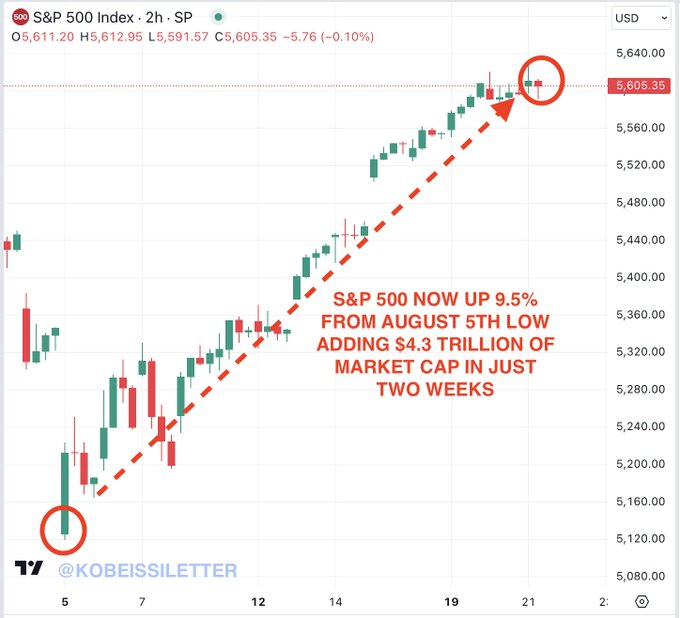
In anticipation of a new all-time high, the index is showing bullish short-term performance. Notably, on August 21, the index was up 9.5% from its August 5th low, adding $4.3 trillion to its market cap.
This value translates to $4.3 trillion in 13 trading days, or $330 billion of market cap added daily since August 5th, with the index remaining up almost 19% on a year-to-date basis.
Meanwhile, as the analyst highlights possible upside for the index, a section of the market believes it will likely be a casualty of a potential recession. For instance, as reported by Finbold, economist Henrik Zeberg has maintained that investors should prepare for a recession, but first, the S&P 500 will hit new highs before crashing.
Disclaimer: The content on this site should not be considered investment advice. Investing is speculative. When investing, your capital is at risk.