
Bitcoin (BTC) started the weekend with a slightly more positive sentiment after a mostly bearish week, seeing some price recovery. However, a technical analyst warns of more downside potential for the leading cryptocurrency, looking at the one-hour chart.
Ben Walther, a high-reputation analyst on TradingView, shared two recent Bitcoin price analyses that examined key levels and chart patterns. In both analyses, Walther concluded that BTC could still see significantly lower prices against the dollar, eyeing sub-$54,000.
As of this writing, Bitcoin trades at $59,450, recovering from the price crash to $50,000 in early August. Despite the crash-to-date recovery, BTC still trades with 6.77% losses in the last 30 days, below the $60,000 key psychological level.
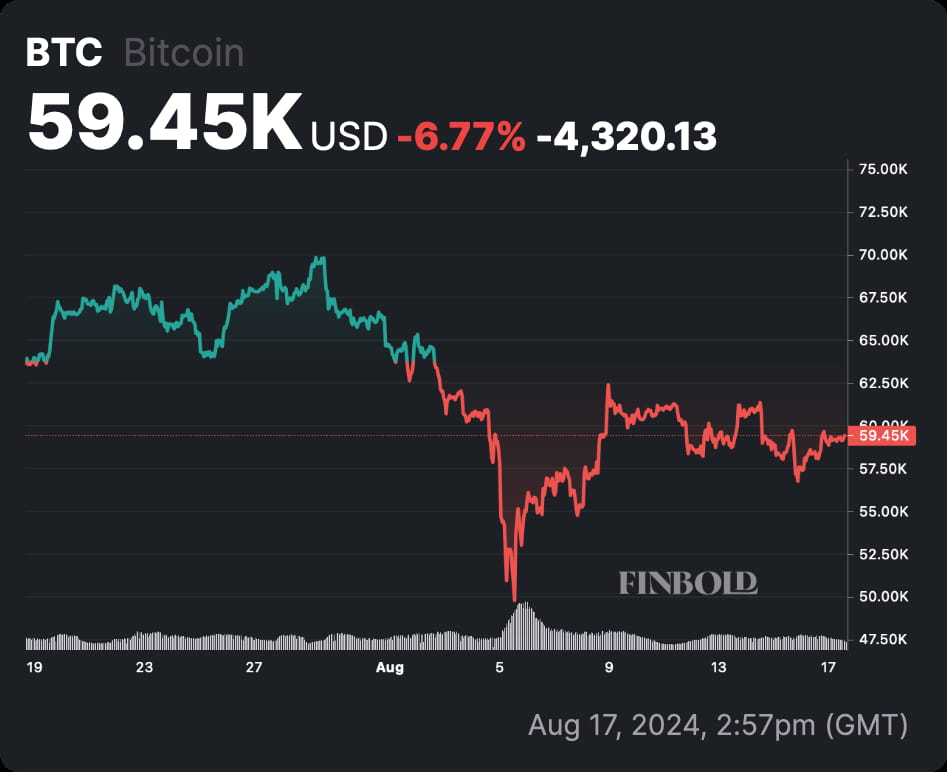
Bitcoin (BTC) 30-day price chart. Source: Finbold
Bitcoin’s key support level was briefly broken
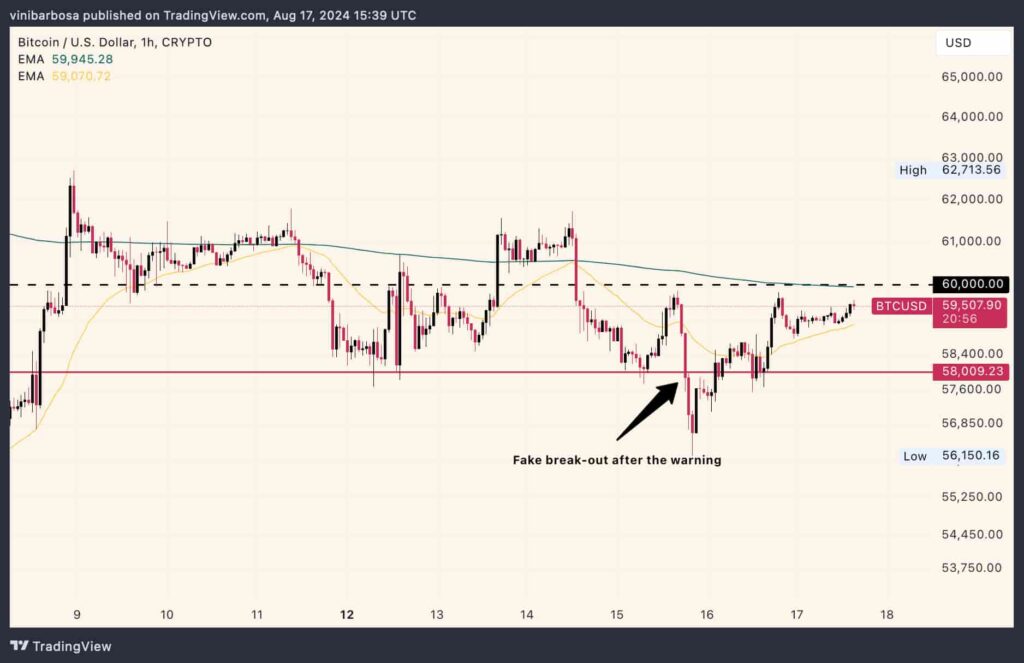
On August 15, Walther shared the first analysis of Bitcoin and Ethereum (ETH), tracing key support levels for both cryptocurrencies. The analyst explained BTC’s $58,000 was a key level to watch, warning of a potential downside if it broke.
Indeed, Bitcoin lost support and crashed to as low as $56,000, just to recover right after above this level.
BTC descending broadening wedge indicates ‘more down’
One day later, the analyst shared another insight, highlighting a “descending broadening wedge” chart pattern, indicating more downside potential. According to Ben Walther, this pattern is “characterized by two diverging trendlines and the price making lower highs and lower lows.”
Moreover, the trader explained that a descending broadening wedge is usually a bullish sign, likely to break out upwards. Nevertheless, this forecast is only valid when the asset shows a decreasing volume within the downtrend.
Bitcoin’s current situation plays the opposite scenario here, showing an increasing volume weighted to the sell side. This indicates a higher market interest in selling BTC for lower lows and a lack of interest in buying the higher highs – suggesting Bitcoin could break out from this pattern to the downside, bringing significant losses.
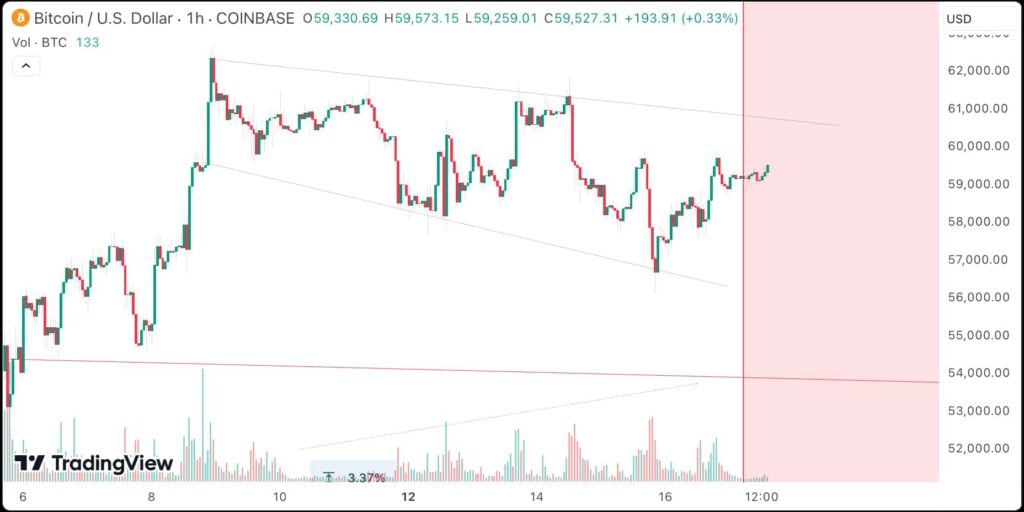
Therefore, the analyst warns of a potential rally above $60,000, making a bull trap at the pattern’s resistance. A sharp price drop would likely follow this bull trap, testing the descending broadening wedge support again. Losing this support would be extremely bearish for Bitcoin in the next few days, potentially visiting local bottoms.
Traders should be careful and expect high short-term volatility, closely monitoring BTC’s price action.
Disclaimer: The content on this site should not be considered investment advice. Investing is speculative. When investing, your capital is at risk.