
Once again, Bitcoin (BTC) bulls have failed to push the crypto above $60,000, but analysis indicates that the asset will likely rally in the future.
In a TradigView post shared on July 12, trading expert TradingShot pointed out that Bitcoin is poised for its most aggressive phase yet.
The expert’s analysis delved into Bitcoin’s cyclical angles and relative strength index (RSI) to argue for a significant price movement in the near future.
The expert illustrated the historical progression of Bitcoin’s price cycles, each defined by distinct angles from top to bottom. The analysis highlighted a pattern where each cycle exhibits a decreasing angle.
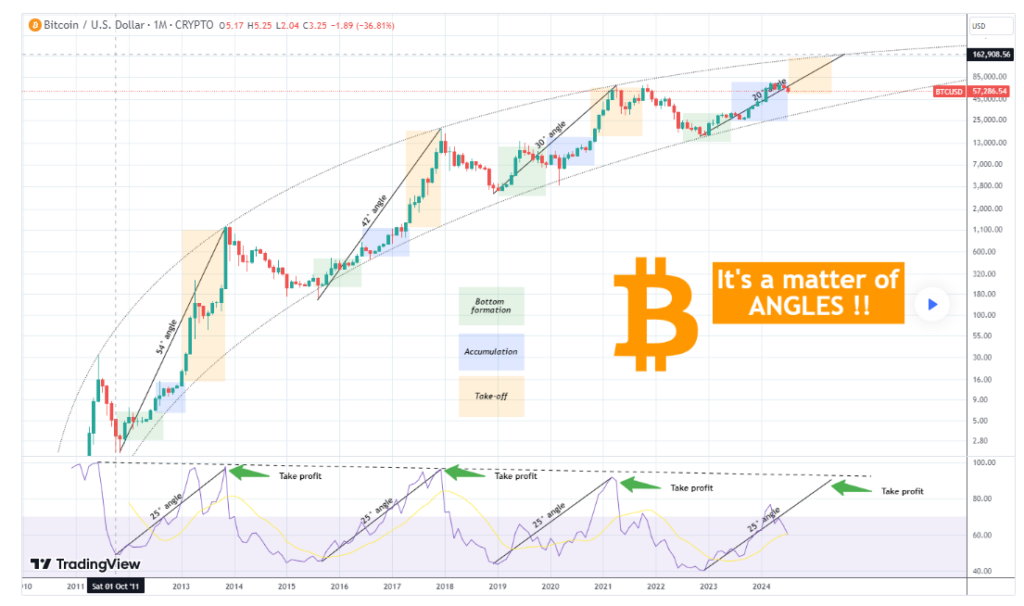
The first cycle, from 2012 to 2013, was marked by a 54° angle. The second cycle, from 2015 to 2017, had a 42° angle, and the third cycle, from 2019 to 2021, showed a 30° angle.
Based on this pattern, the current cycle is projected to top at around 20° from the bottom. Despite the declining angle rates, the one-week RSI has shown remarkable stability.
Each bull cycle’s RSI has consistently peaked at approximately 25°, providing a reliable indicator for when to sell and secure profits before the onset of the next bear cycle.
Upcoming take-off phase
The analysis further classified Bitcoin’s market movements into distinct phases: bottom formation, accumulation, and take-off. According to TradingShot, Bitcoin is currently within its accumulation phase, indicating that the most aggressive price movements, referred to as the take-off phase, are yet to come.
“On top of all the above, we see that according to the Bull Cycle phases classification, Bitcoin is still within its Accumulation Phase (blue Rectangle), so we haven’t yet seen its most aggressive part, the Take-off Phase,” the expert said.
Indeed, the explanation for the accumulation zone could relate to the current Bitcoin price movement, which has recently seen consolidation. Breaching the $60,000 resistance area is the primary concern for bulls.
Overall, Bitcoin failed to capitalize on the slowing inflation data after rising to as high as $59,300. The asset’s inability to advance can be attributed to recent supply overhangs related to the repayment of Mt. Gox creditors and the German government’s selling of seized Bitcoin.
Bitcoin price analysis
By press time, Bitcoin was trading at $57,986 with daily losses of almost 1%. On the weekly chart, BTC is up over 3%.
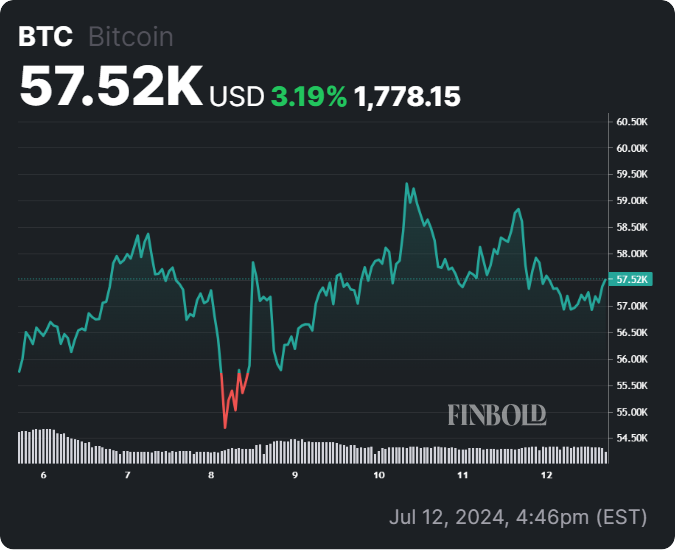
In the meantime, Bitcoin bulls should strive to hold the asset above the $57,500 support. This position would validate any formidable move towards $60,000.
Disclaimer: The content on this site should not be considered investment advice. Investing is speculative. When investing, your capital is at risk.