
As Bitcoin (BTC) continues to struggle under $27,000, the flagship decentralized finance (DeFi) asset has been diverging from the stock market for some time now, indicating that the traditional correlation between cryptocurrencies and stocks may be coming to an end, which could have implications on the maiden crypto asset itself.
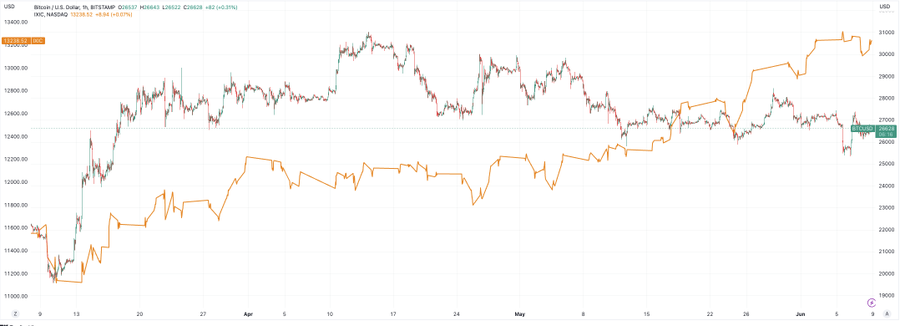
Specifically, finance and economy reporter David Lin has noted that Bitcoin has been diverging from the Nasdaq index for two weeks now as technology stocks “grind higher while Bitcoin trends lower,” whereas “the two have historically moved in tandem,” as he explained in a tweet shared on June 8.
What it means
As Lin specified, such chart patterns may indicate three things – the undervalued state of Bitcoin, overvalued technology stocks, and continuation of divergence. Typically, the historic correlation between stocks and Bitcoin would mean there is more room for Bitcoin to catch up. However, the weakening of this trend could render such an expectation fruitless.
On the other hand, Bitcoin being undervalued compared to stocks, which are rallying, does not necessarily mean a downside is in the cards. In fact, low prices could lure more investors into buying the crypto asset in a bid to accumulate before the price moves up, which, in turn, could happen as a result of increased demand.
Ethereum diverges as well
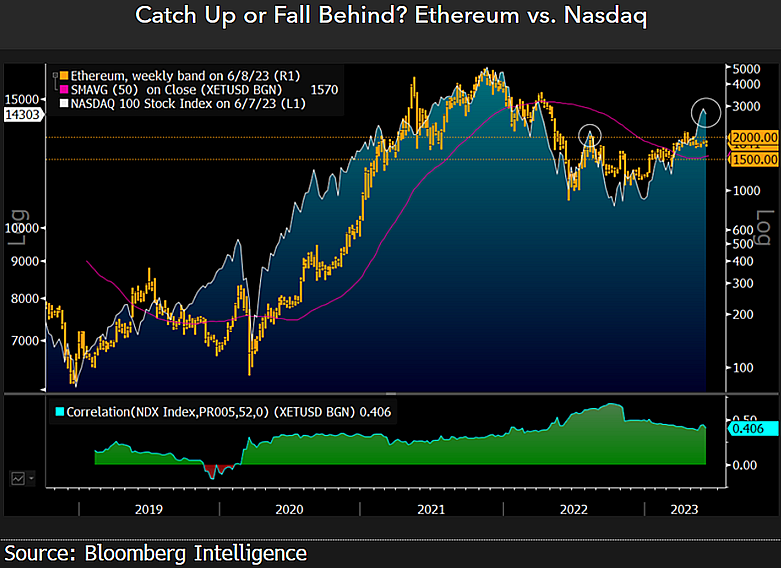
At the same time, Bitcoin is not the only major digital asset that is showing divergent weakness to the stock market. Notably, Ethereum (ETH) has failed to stay above the $2,000 threshold despite a 52-week high in the Nasdaq 100 Stock Index in the second quarter of 2023.
According to Bloomberg’s senior commodity specialist Mike McGlone, such a constellation of things “may portend a resistance ceiling for the crypto,” and Ethereum “may depend on the stock index to lift all the boats,” as he explained in a tweet and chart posted on June 8.
Bitcoin price analysis
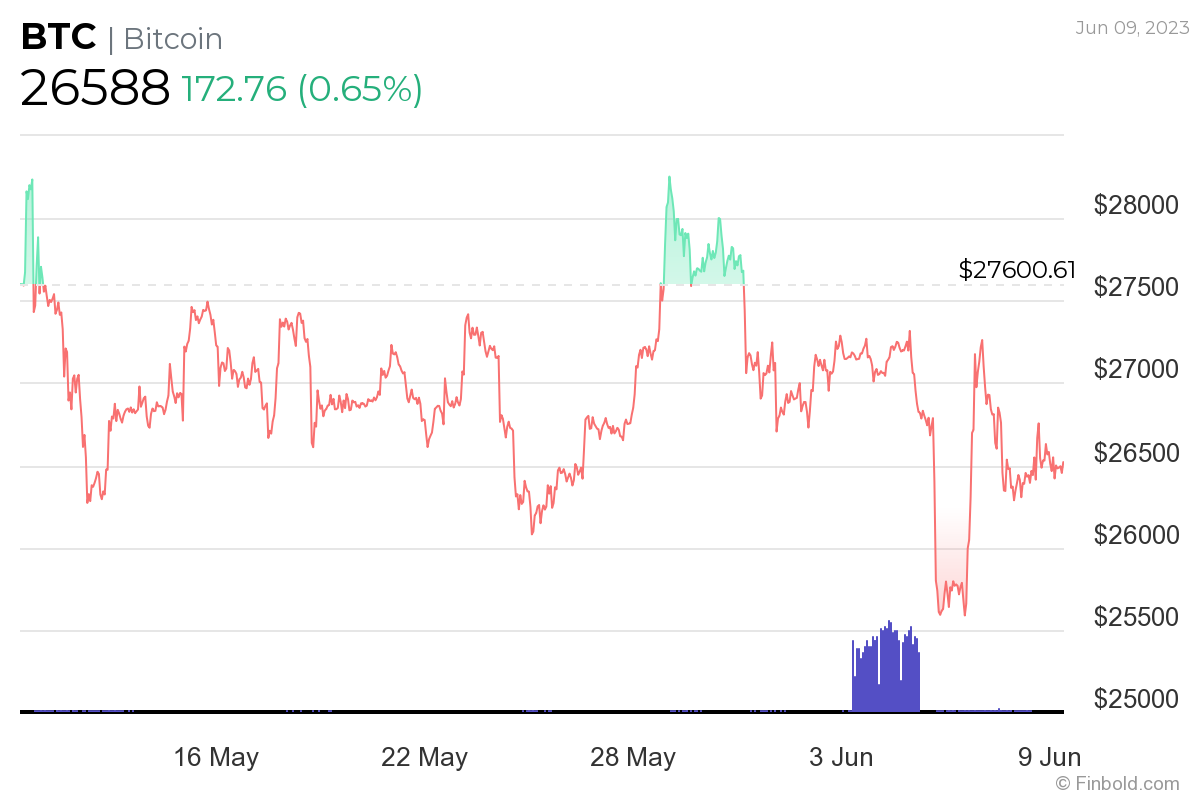
Meanwhile, Bitcoin was at press time ranging around the mid-$26,500s, currently changing hands at the price of $26,588, as it demonstrates a climb of 0.65% on the day but still writes down the losses of 1.90% across the previous week and 3.59% on its monthly chart.
Simultaneously, Ethereum was at the time of publication trading at the price of $1,841.56, itself recording a modest increase of 0.05% in the last 24 hours and 0.05% across the past 30 days, whereas on the weekly chart, it has declined 2.35%, as per data retrieved on June 9.
Disclaimer: The content on this site should not be considered investment advice. Investing is speculative. When investing, your capital is at risk.