
Bitcoin (BTC) may be facing a significant correction after a key bearish technical signal emerged on the three-day chart, raising the possibility of a move toward the $36,000 level.
According to insights from TradingShot in a TradingView post on March 6, this outlook stems from the fact that the cryptocurrency has formed a death cross on the three-day timeframe.
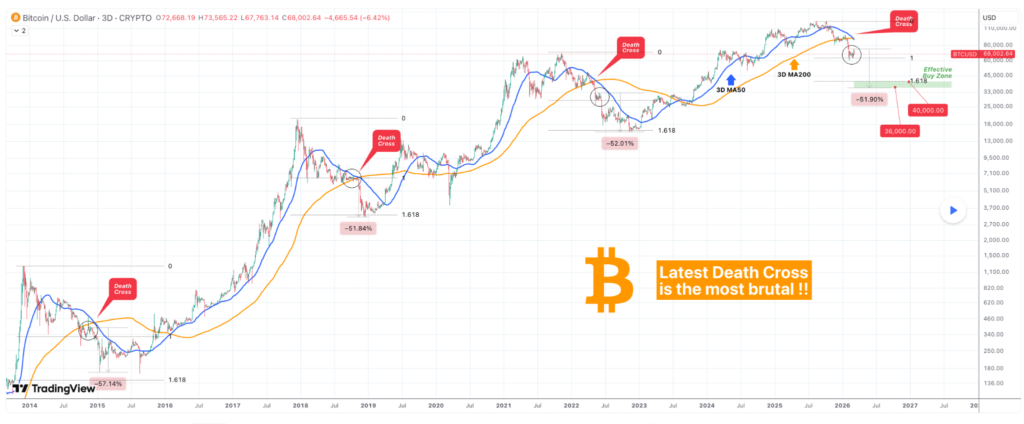
Notably, the pattern occurs when the 50-period moving average (MA50) falls below the 200-period moving average (MA200). The signal historically appears during major bear cycles and has often preceded extended declines in the cryptocurrency’s price.
Based on historical data, each time this pattern has appeared since 2014 during a bear market phase, Bitcoin has continued to fall sharply after the crossover.
During the 2022 market downturn and the 2018 crypto winter, the asset declined by slightly more than 52% after the signal formed. In the earlier 2014 cycle, the drop was even steeper, reaching approximately 57%.
The current setup shows the MA50 turning lower and crossing below the MA200, confirming the bearish crossover. Bitcoin is also trading beneath both trend lines after losing momentum near $70,000, a structure that historically signals weakening market strength.
Bitcoin next low target
If the pattern follows previous cycles, Bitcoin could see a similar decline. A roughly 52% drop from the crossover area would place the price near $36,000, aligning with the 1.618 Fibonacci extension that marked bottoms during the 2018 and 2022 bear markets.
Based on this historical behavior, analysts view the $40,000 to $36,000 range as a potential accumulation zone, with $40,000 aligning with the Fibonacci extension and $36,000 reflecting the typical post–death cross decline seen in prior cycles.

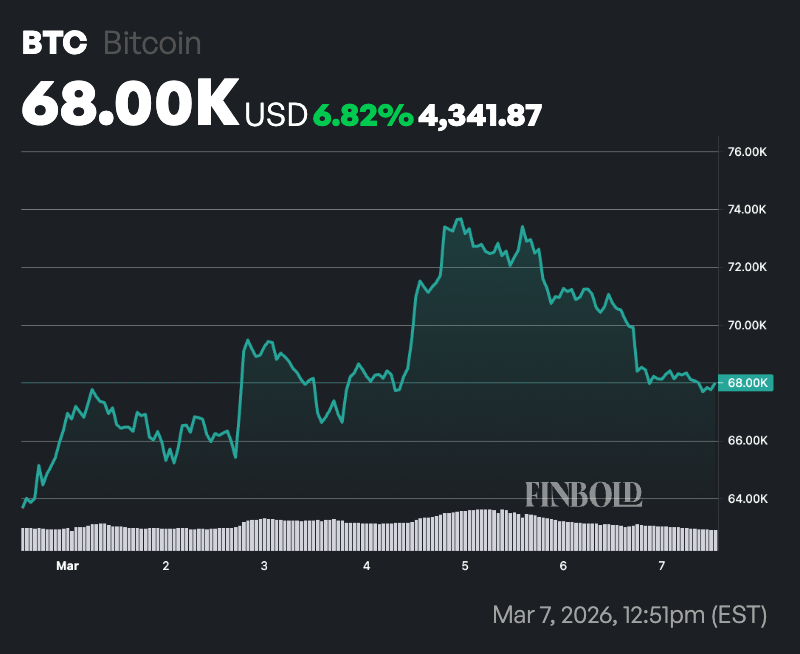
This bearish outlook comes after the cryptocurrency climbed to nearly $74,000 between March 4 and March 5, marking a one-month high and briefly boosting trader optimism.
The move was driven by short squeezes, renewed inflows into spot Bitcoin ETFs, and perceived resilience amid escalating geopolitical tensions in the Middle East.
During the rally, Bitcoin also moved alongside a strengthening U.S. dollar, an unusual correlation that has emerged since late 2024.
However, the momentum quickly faded, with a pullback wiping out much of the week’s gains.
Bitcoin price analysis
At the time of reporting, Bitcoin was priced at $67,955, well below its 50-day SMA of $75,548 and significantly under the 200-day SMA at $96,080.
Trading beneath both moving averages typically signals bearish market conditions and indicates that the broader trend remains under pressure.
Momentum indicators, however, paint a more balanced picture. Bitcoin’s 14-day Relative Strength Index (RSI) currently stands at 45.93, placing it firmly in neutral territory. The RSI measures the speed and magnitude of price movements on a scale from 0 to 100.