
After it finally crossed the $30,000 psychological threshold, Bitcoin (BTC) is currently looking at a strong resistance zone around $31,000, and if it manages to break it, a significant bull run could follow, and historical chart patterns suggest it might even reach $80,000 by the end of 2023.
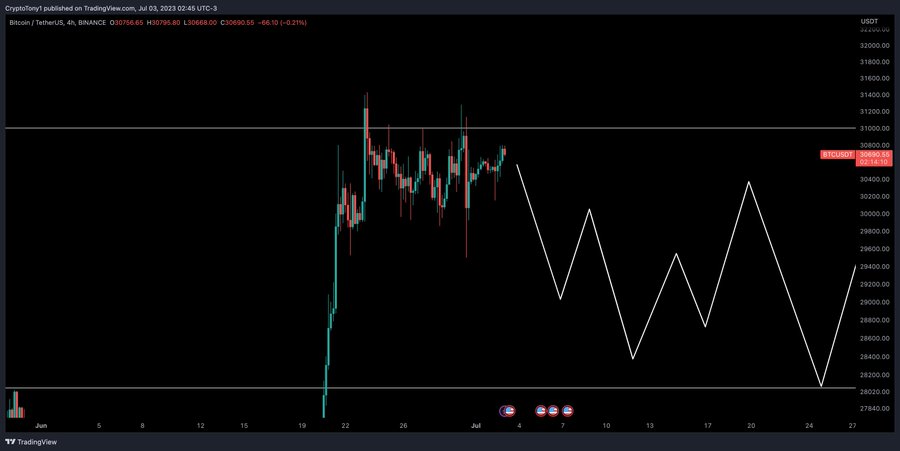
As it happens, a cryptocurrency market analyst known as Crypto Tony has pointed out that if Bitcoin fails to take out the resistance area at $31,000 this week, it could “draw down to $28,000 for a reload option from the bears,” according to his tweet on July 3.
Bullish future
On the other hand, as another pseudonymous crypto trading analyst, Stockmoney Lizards, noted, “the more frequently a resistance line is tested, the weaker it becomes,” demonstrating with an example of the $470 resistance Bitcoin tested multiple times in 2016 until it broke.
Indeed, as crypto expert Altcoin Sherpa earlier observed based on the one-month levels, the decentralized finance (DeFi) asset is “still targeting $40k in the mid-term,” as it closes above $29.3k for the first time in one year, according to the analysis and chart shared on June 30.
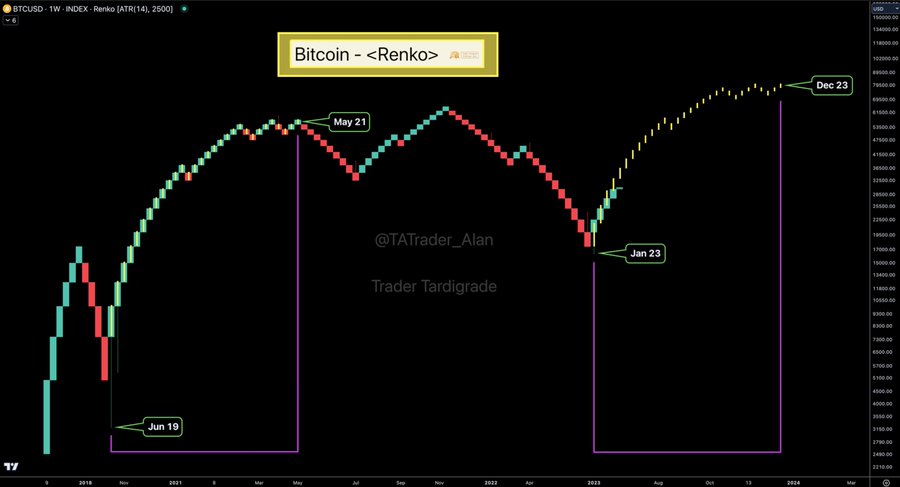
Meanwhile, Trader Tardigrade has stated that Bitcoin’s Renko chart, which relies on price movement rather than both price and standardized time intervals like most charts, is following the same moves as in 2019-2021, indicating that the maiden cryptocurrency could hit $80,000 at the end of 2023.
On top of that, the above analysis echoes that of another crypto specialist, known on Twitter as Moustache and el_crypto_prof, who highlighted that Bitcoin’s bullish megaphone pattern was “still intact” and that its upper-trendline target stood at $85,000 toward the year’s end.
Bitcoin price analysis
In the meantime, Bitcoin was trading at the price of $30,661, indicating a recovery of 0.42% on the day and of 0.88% across the previous week, adding up to the more significant monthly gain of 12.87%, according to the latest charts retrieved by Finbold on July 3.

It is also worth noting that the above prognosis is a lot more bullish than those of the self-learning machine algorithm deployed by the crypto tracking platform CoinCodex, which currently projects that the price of Bitcoin by the end of 2023 will move below the area of $38,000.
Disclaimer: The content on this site should not be considered investment advice. Investing is speculative. When investing, your capital is at risk.