
Bitcoin (BTC) continues to cling to the $67,000 mark, with bears and bulls failing to push the maiden cryptocurrency’s price in either direction significantly.
Amid the standoff, crypto trading expert TradingShot has pointed out that chart patterns indicate a possible explosive Bitcoin price breakout.
In a TradingView post on May 31, the expert noted that Bitcoin is on the verge of completing the right shoulder of the inverse head and shoulders (IH&S) pattern, a bullish indicator that emerged following the cryptocurrency’s all-time high on March 14.
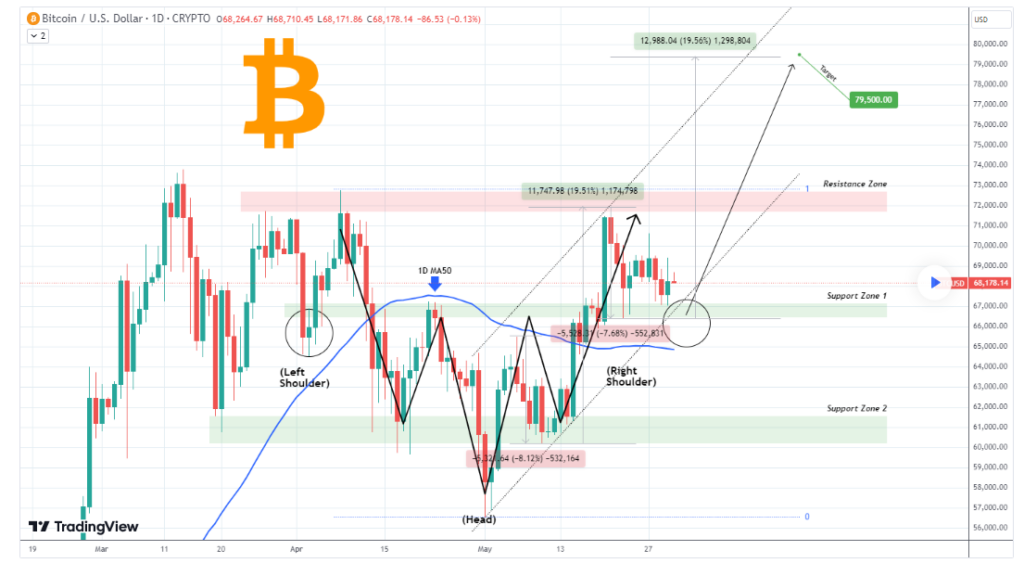
The IH&S pattern, a well-known bullish reversal formation, suggests a shift from a downtrend to an uptrend. The formation comprises three parts: the left shoulder, the head, and the right shoulder. Therefore, completing the right shoulder signals the potential start of a significant upward move.
Additionally, the current price movement is contained within an upward channel. This “Channel Up” pattern has shown a previous bullish leg peaking at 19.50%, followed by two bearish legs of approximately -8% each, reinforcing the structural symmetry in Bitcoin’s price movements.
Support zones resilience
The analysis also highlighted distinct support and resistance zones within the IH&S pattern. Support zone one has demonstrated resilience, holding firm twice since May 23. This suggests a strong buying interest at this level, providing a foundation for the anticipated bullish move.
At the same time, the analyst noted that the 50-day moving average is another critical indicator. As long as Bitcoin’s price remains above this moving average, the bullish trend is expected to persist, likely culminating in a price near the $80,000 level.
“As a result, as long as it holds along with the 1D MA50, the trend remains bullish, and the IH&S technical dynamics target the 2.0 Fibonacci extension at $89,000. However, we keep at the moment a shorter term perspective, and before 89k, we will aim at $79,500, which would be a +19.50% rise, similar to the Channel’s previous Bullish Leg,” the expert said.
Bitcoin’s failed attempt towards $70,000
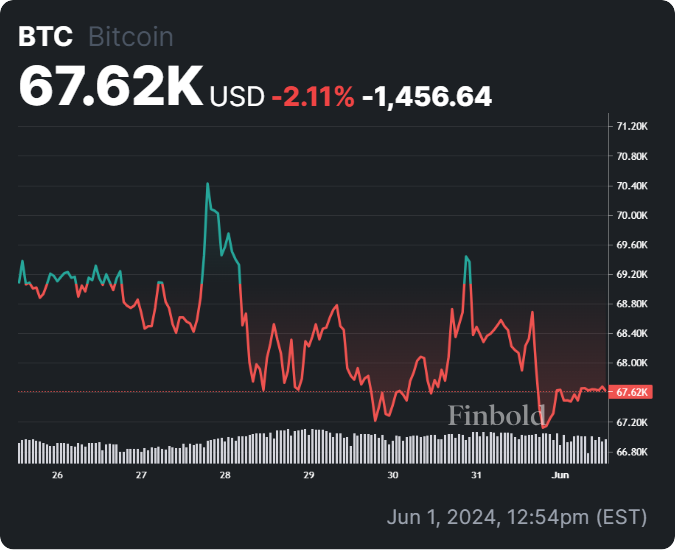
It’s worth noting that Bitcoin returned to trading above the $67,000 level after a failed attempt to reclaim the $70,000 mark in the last 24 hours. Notably, Bitcoin rose to $69,000 on May 31 but failed to hold that position.
The surge receded after the latest United States gross domestic product data reached 1.3% for the first three months annually, missing the forecast of 1.6%. The data implied that American consumers spent less, casting uncertainty over the future of the U.S. economy.
Indeed, Bitcoin also corrected amid a hacking incident that affected the Japanese cryptocurrency exchange DMM Bitcoin, which lost over $300 million worth of Bitcoin.
Amid the current Bitcoin price movement, Michaël van de Poppe, founder and CEO of MNTrading, noted that the market is in equilibrium and investors should watch the crucial level of $66,000.
Bitcoin price analysis
At the time of writing, Bitcoin was trading at $67,620, having corrected by about 0.80% in the last 24 hours. On the weekly chart, Bitcoin is down over 2%.
Overall, amid expert projections, investors will hope Bitcoin’s next price action aligns with the bullish post-halving rally.
Disclaimer: The content on this site should not be considered investment advice. Investing is speculative. When investing, your capital is at risk.