
As the bullish week for the majority of participants in the cryptocurrency market unfolds, the monthly chart of its representative asset – Bitcoin (BTC) – is painting an optimistic picture as well, and crypto analysts are eyeing a strong move up for its price that could even culminate at $47,000.
Specifically, Bitcoin’s monthly chart looks exceptionally bullish, trending upwards as its monthly relative strength index (RSI) on the most recent 14 periods is recording a reading of 50.45, according to the recent chart analysis posted by the pseudonymous cryptocurrency analyst Stockmoney Lizards on April 4.
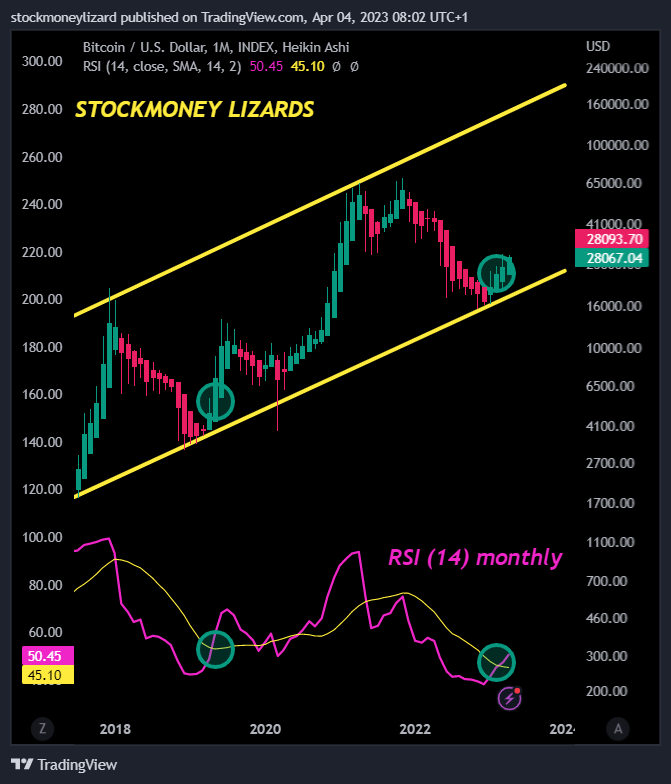
Notably, the RSI indicator is a technical analysis (TA) tool that measures the speed and change of price movements to assess overvalued or undervalued conditions for an asset. In the above case, Bitcoin is settling into a middle road between the overbought and oversold situation.
Picks for you
Road toward $47,000?
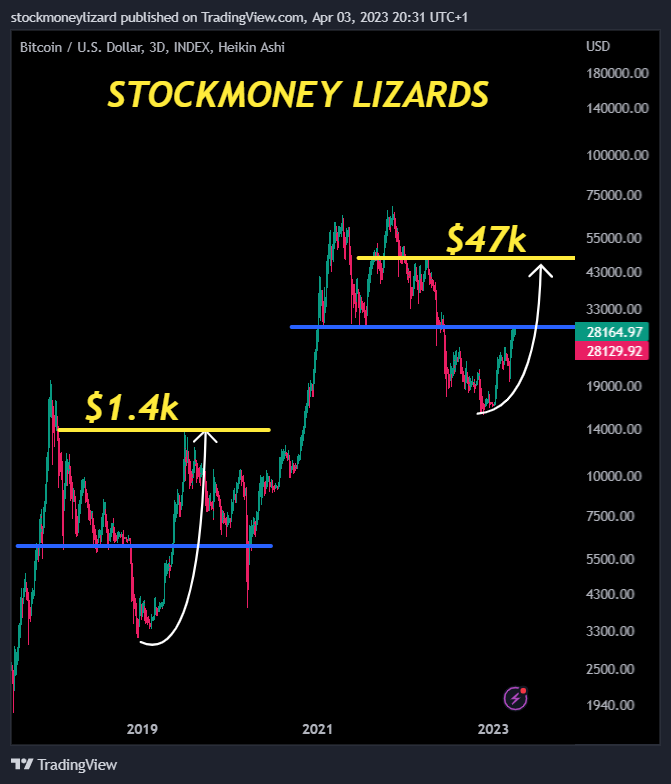
On top of that, the same crypto trading expert earlier made a comparison between the movements of Bitcoin in 2021-2023 to those in the period 2017-2020, suggesting that there was a strong chance of the flagship decentralized finance (DeFi) asset advancing toward $47,000 in the following months.
Another digital asset expert, Michaël van de Poppe, believes a similar scenario is possible, stating that Bitcoin was witnessing a “classic sweep” and that the “trend remains to be upwards, as we’re in a vacuum of ‘relief’ as the hiking process comes to an end.”
According to him:
“Most likely, we’ll see Bitcoin continue to $40K, but if we’ll be having a test of $25K first, I’ll be a buyer.”
Bitcoin price analysis
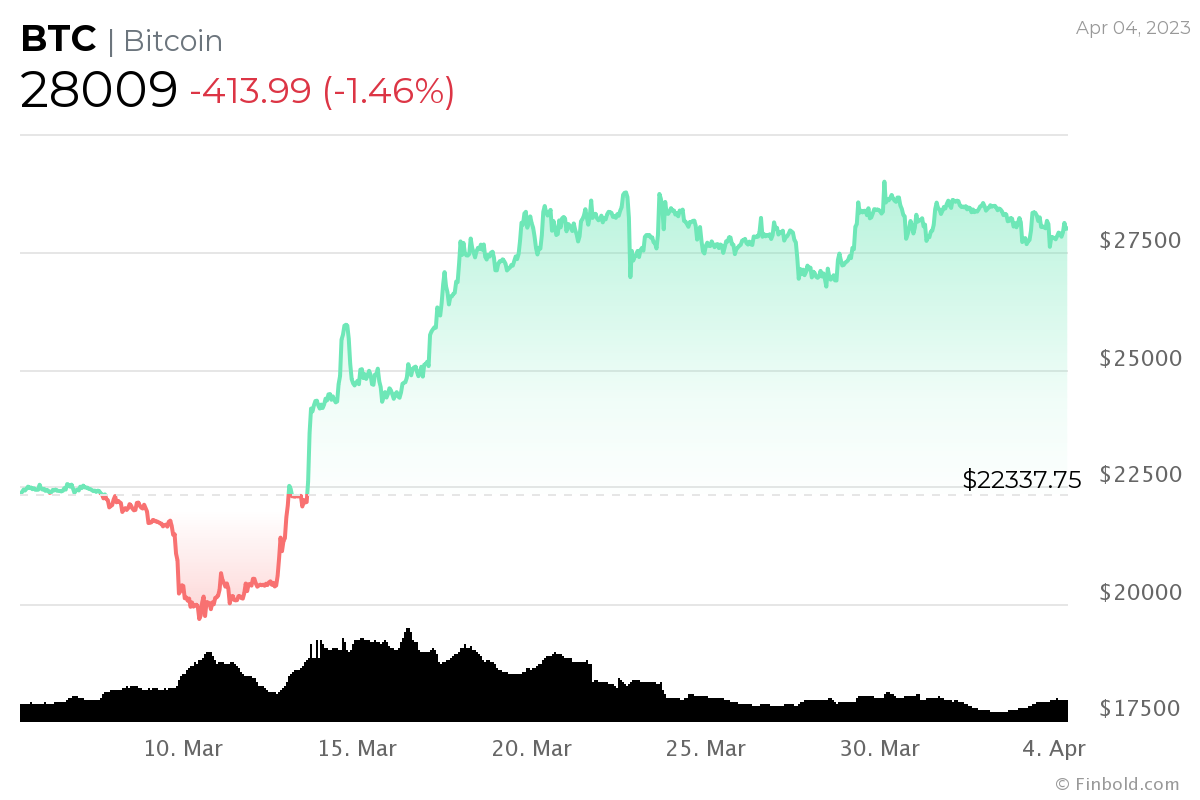
Meanwhile, Bitcoin was at press time changing hands at the price of $28,009, recording a slight decline of 1.46% on the day but still gaining 3.04% over the previous seven days, adding up to the monthly increases of 25.33%, as the charts demonstrate.
It should also be noted that the maiden digital asset has recently had “another weekly closer over the sampling period in the Gaussian Channel,” which crypto analyst Moustache interpreted as a good sign, indicating that $30,000 or more was “only a matter of time,” as Finbold reported on April 3.
Disclaimer: The content on this site should not be considered investment advice. Investing is speculative. When investing, your capital is at risk.