
Bitcoin’s (BTC) price is still consolidating below $17,000, with investors monitoring the asset for a possible bottom that would likely usher in a new rally. In attempts to figure out Bitcoin’s next move, observing the flagship cryptocurrency’s historical price trendline can give a hint.
In this line, a crypto trading expert by the pseudonymous Goldenbreakout on TradingView pointed out that after weeks of sideway trading pattern, Bitcoin’s last all-time high of almost $69,000 began building momentum after the asset hit the $9,000 level. The position was observed in July 2020.
At the same time, as Bitcoin currently exhibits a sideway pattern, the analyst noted that BTC could form a similar trendline to the last bull run but will need to correct further to $9,000.
Picks for you
According to the expert, Bitcoin undergoing a free fall will result in new volume exiting the asset before offering room for investors to enter the market.
“Are we going to get the free falls, as we did get before? There is a possibility that we are going to enter into much more down volume so that new volume will enter BTC. Most of the time, when the price of BTC stays for the long term stable, the effect comes in later moments huge,” the analyst said.
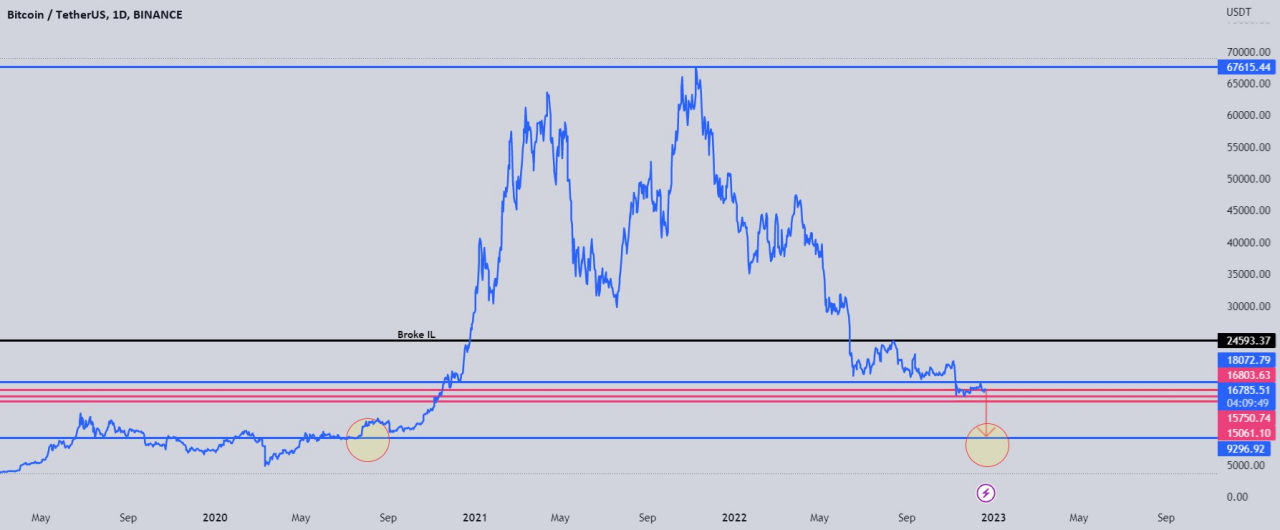
Indeed, suppose the $9,000 position is a crucial foundation for Bitcoin to rally; investors will likely need to brace for more pain in the coming weeks. Notably, Bitcoin had attempted to rally in the wake of the positive macroeconomic factors. However, the asset failed to hold the gains.
Bitcoin price analysis
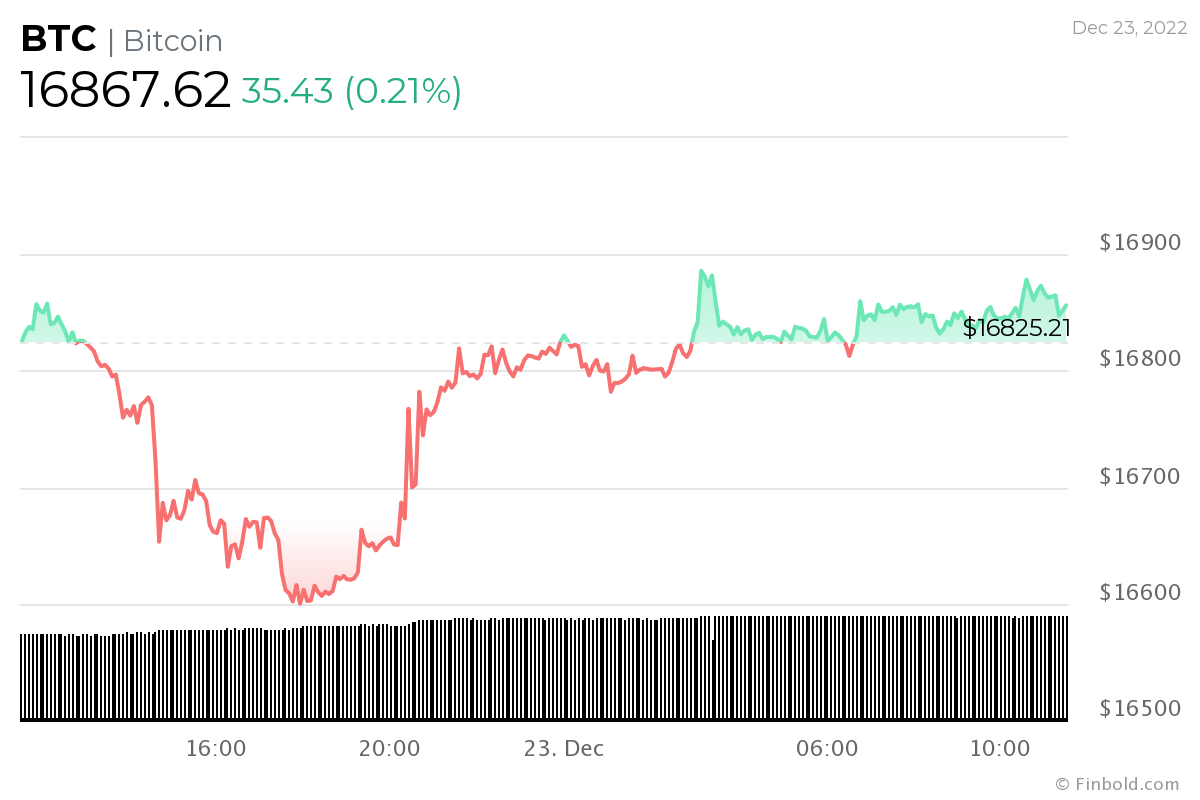
By the time of publishing, Bitcoin was trading at $16,867, representing a minor price growth of about 0.2% in the last 24 hours. The weekly chart is also demonstrating Bitcoin’s current consolidation phase, with asset correcting by 0.75%.
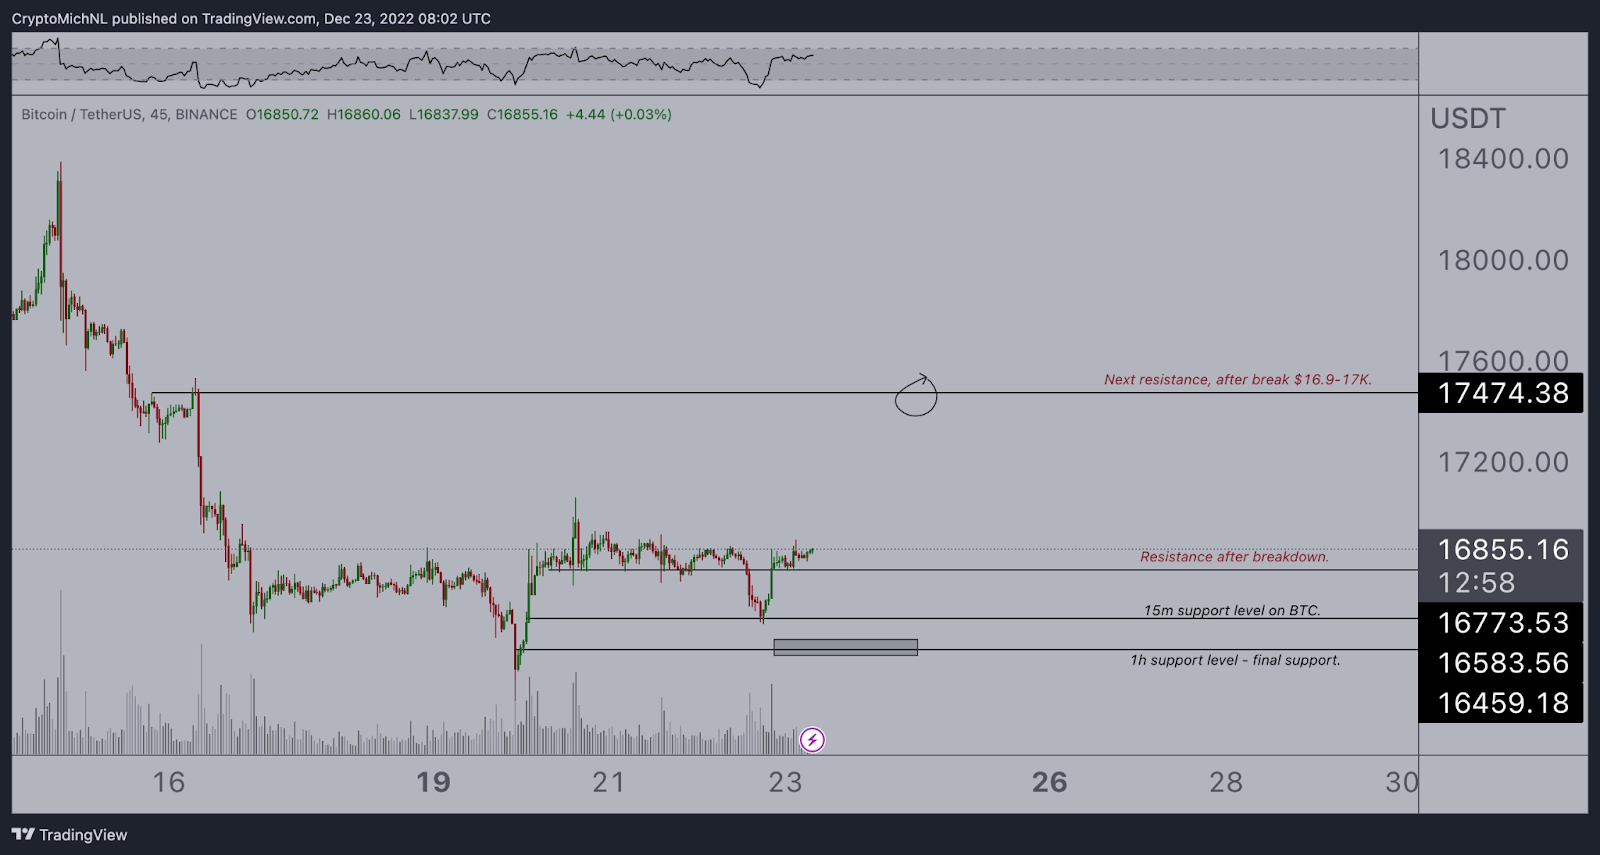
At the current price, a crypto trading expert, Michaël van de Poppe in a tweet on December 23, suggested that if Bitcoin holds the $16,750 position, the asset could break and rally to the range of $16,900 to $17,000 and target $17,450.
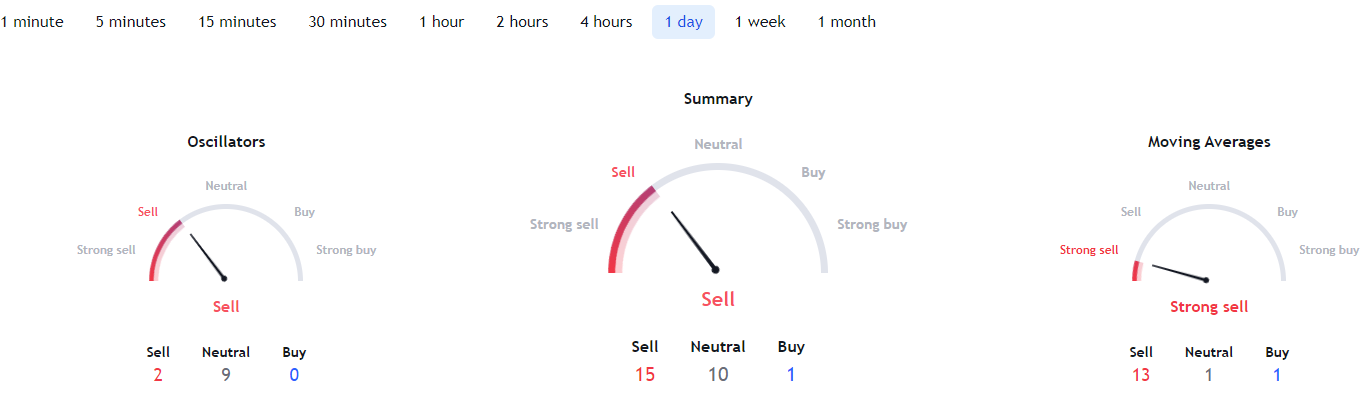
Bitcoin technical analysis
Elsewhere, Bitcoin technical analysis remains bearish, with a summary of the daily gauges on TradingView supporting the ‘sell’ sentiment at 15 while moving averages are for the ‘strong sell’ at 13.
In the meantime, as reported by Finbold, PricePrediction’s machine-learning algorithm set Bitcoin’s price for January 1, 2023, at $16,722.
Disclaimer: The content on this site should not be considered investment advice. Investing is speculative. When investing, your capital is at risk.