As the semiconductor industry continues to flourish, driven by the expanding demand for 5G, artificial intelligence (AI), and the Internet of Things (IoT), Broadcom (NASDAQ: AVGO) stands out as a key player poised for significant growth.
With a market capitalization of $771.41 billion, Broadcom has delivered substantial returns, including a year-to-date (YTD) increase of 48% and a 6-month gain of 24%.
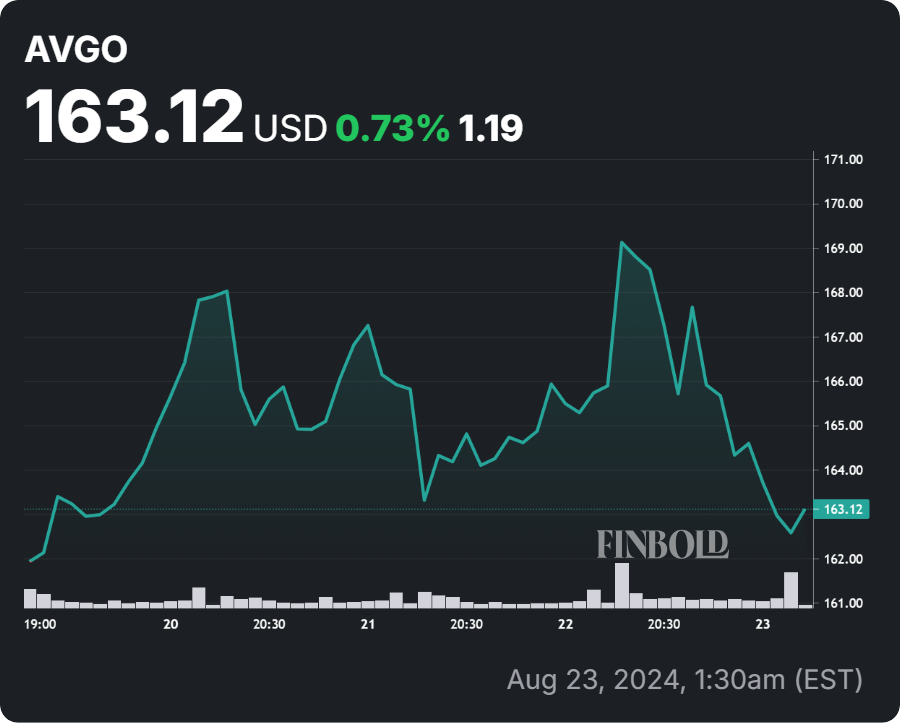
However, the stock recently experienced a minor pullback, losing 2.08% in the latest trading session on August 22, setting the price at $163.75.
Despite this slight dip, analysts remain optimistic about Broadcom’s future, with predictions indicating that the stock is on the brink of a major rally.
Notably, trading expert TradingShot has identified Broadcom as being in a strong position for significant upward movement, especially following its recent period of consolidation.
Broadcom’s technical analysis
Broadcom’s technical chart pattern reveals a well-defined “Channel Up” pattern, a bullish formation characterized by a series of higher highs and higher lows.
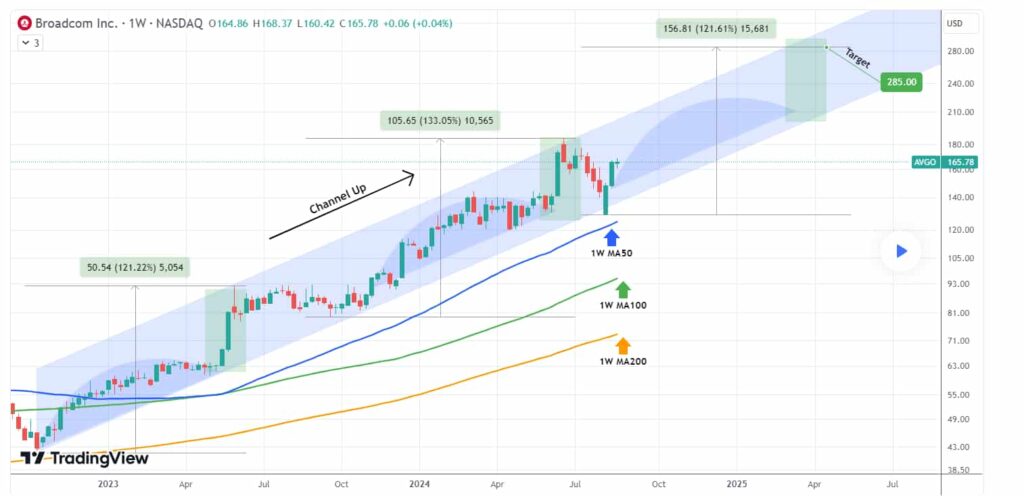
This pattern, which has been in place since the market bottom in October 2022, has guided Broadcom through significant gains over the past year.
The stock’s ability to maintain this upward channel is a strong indicator of its potential for continued growth. Currently, Broadcom is trading above the 50-week moving average (1W MA50), which has consistently acted as a critical support level.
This has helped the stock recover quickly from the July-led correction. Additionally, the 100-week (1W MA100) and 200-week (1W MA200) moving averages, which lie further below, indicate long-term support and reinforce the stock’s overall bullish trend.
Broadcom’s historical performance within the Channel Up pattern has been remarkable, with two major upward movements showcasing gains of +121% and +133%.
These increases within the channel highlight the stock’s potential for substantial growth. Given the current positioning within the channel, Broadcom is now set for its third long-term expansion wave.
Timing the target: When will Broadcom stock hit $285?
Given the current momentum and the historical pace of upward moves within the channel, Broadcom is expected to reach the $285 target by mid-2025.
This timeline considers the stock’s resilience, its ability to recover from corrections, and the sustained demand for its semiconductor and infrastructure products.
By projecting a similar +121% gain from its recent bottom, Broadcom could reach the $285 mark, aligning with the upper boundary of the channel, suggesting that the stock has ample room to rise within this bullish formation.
The previous two waves followed a similar trajectory, and if Broadcom continues to adhere to this pattern, the $285 target becomes increasingly likely.
Broadcom’s technical setup, supported by strong market fundamentals, positions the stock for a significant breakout. With a target of $285 in sight, Broadcom offers a promising opportunity for investors and traders looking to capitalize on its next major rally.
Disclaimer: The content on this site should not be considered investment advice. Investing is speculative. When investing, your capital is at risk.