After generating a lot of optimism for nearly 6 months thanks to a significant rally and a string of developments – the biggest of which being spot exchange-traded fund (ETF) approvals and the halving – Bitcoin (BTC) entered into a period of struggle in April and, by May, into a full-blown bloodbath.
Indeed, after hitting a new all-time high (ATH) near $73,000 in March and sparking hopes that halving event might take BTC above $100,000 and possibly – by year’s end – to $300,000, Bitcoin started dropping until it finally crashed to approximately $57,000.
One crypto expert, however, believes the crypto market – at least for BTC – found its bottom, and their technical analysis (TA) of the cryptocurrency shows that the coin is now likely to surge.
TD Sequential hints at looming Bitcoin rally
On May 2, the prominent crypto expert on X, Ali Martinez, posted their technical analysis of Bitcoin which demonstrates that – after briefly dropping below $57,000 – the world’s premier cryptocurrency is poised for a recovery.
An analysis tool known as TD Sequential – designed to identify a likely trend reversal or trend confirmation point – has indeed flashed a substantial buy signal on the daily chart, seemingly confirming a very similar signal that flashed less than a day earlier on the 4-hour chart.
Previously, Martinez assessed that $61,900 serves as an important support zone for Bitcoin with the downside potential being immense should it fall below it – and BTC did face a significant drop after losing the price.
Additionally, another crypto expert – Michaël van de Poppe – opined that Bitcoin will not only find its bottom in the first week of May but that it will drop below $61,000 before regaining an uptrend.
BTC price chart
Whether BTC has indeed found its bottom or a further collapse is incoming, the cryptocurrency has been struggling in recent trading. Indeed, with Bitcoin price today standing at $57,656.10 after a 1.05% daily drop and a 9.09% decline in the last 5 trading days, it is evident the coin failed to provide the expected post-halving results – at least in the short term.
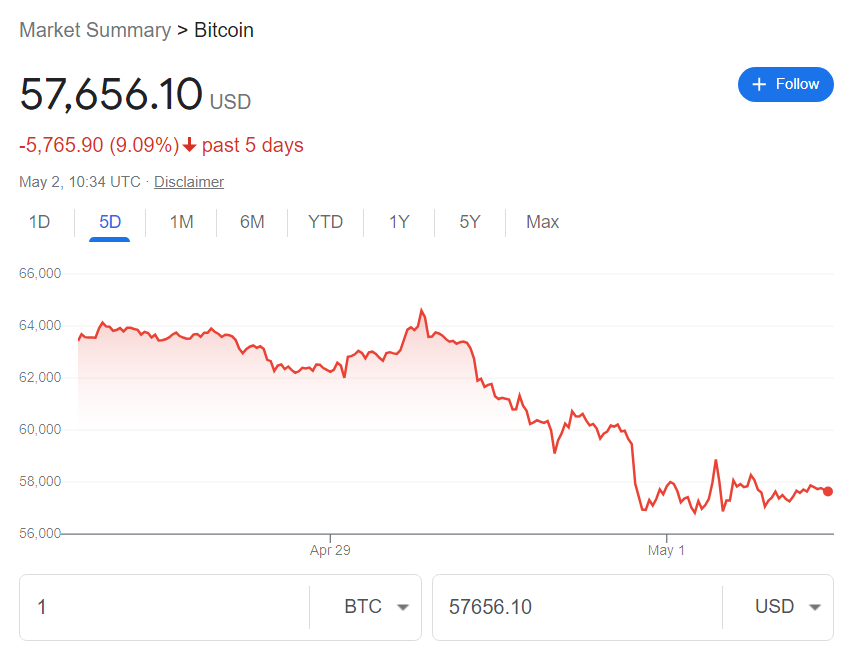
On the other hand, despite the last 30 days of trading being similarly bloody with BTC being 11.93% in the red in the time frame, its longer-term performance has been substantially stronger and the world’s premier cryptocurrency remains 30.53% in the green year-to-date (YTD).
Disclaimer: The content on this site should not be considered investment advice. Investing is speculative. When investing, your capital is at risk.