A fresh wave of investor optimism has breathed new life into the crypto markets over the past week, driving Bitcoin (BTC) above the elusive $34,000 threshold, a level it hadn’t seen since May 2022.
Notably, amidst this resurgence, Dogecoin (DOGE), the leading meme-inspired cryptocurrency, emerged as one of the standout performers.
However, the excitement surrounding DOGE’s fortunes may not be over. On October 29, renowned cryptocurrency analyst Ali Martinez unveiled a significant bullish development for this unconventional digital asset, signaling potential further gains on the horizon.
According to Martinez, also known as ali_charts on X, Dogecoin is demonstrating “promising signs,” with the cryptocurrency “breaking out of a multi-year descending triangle” on the weekly chart.
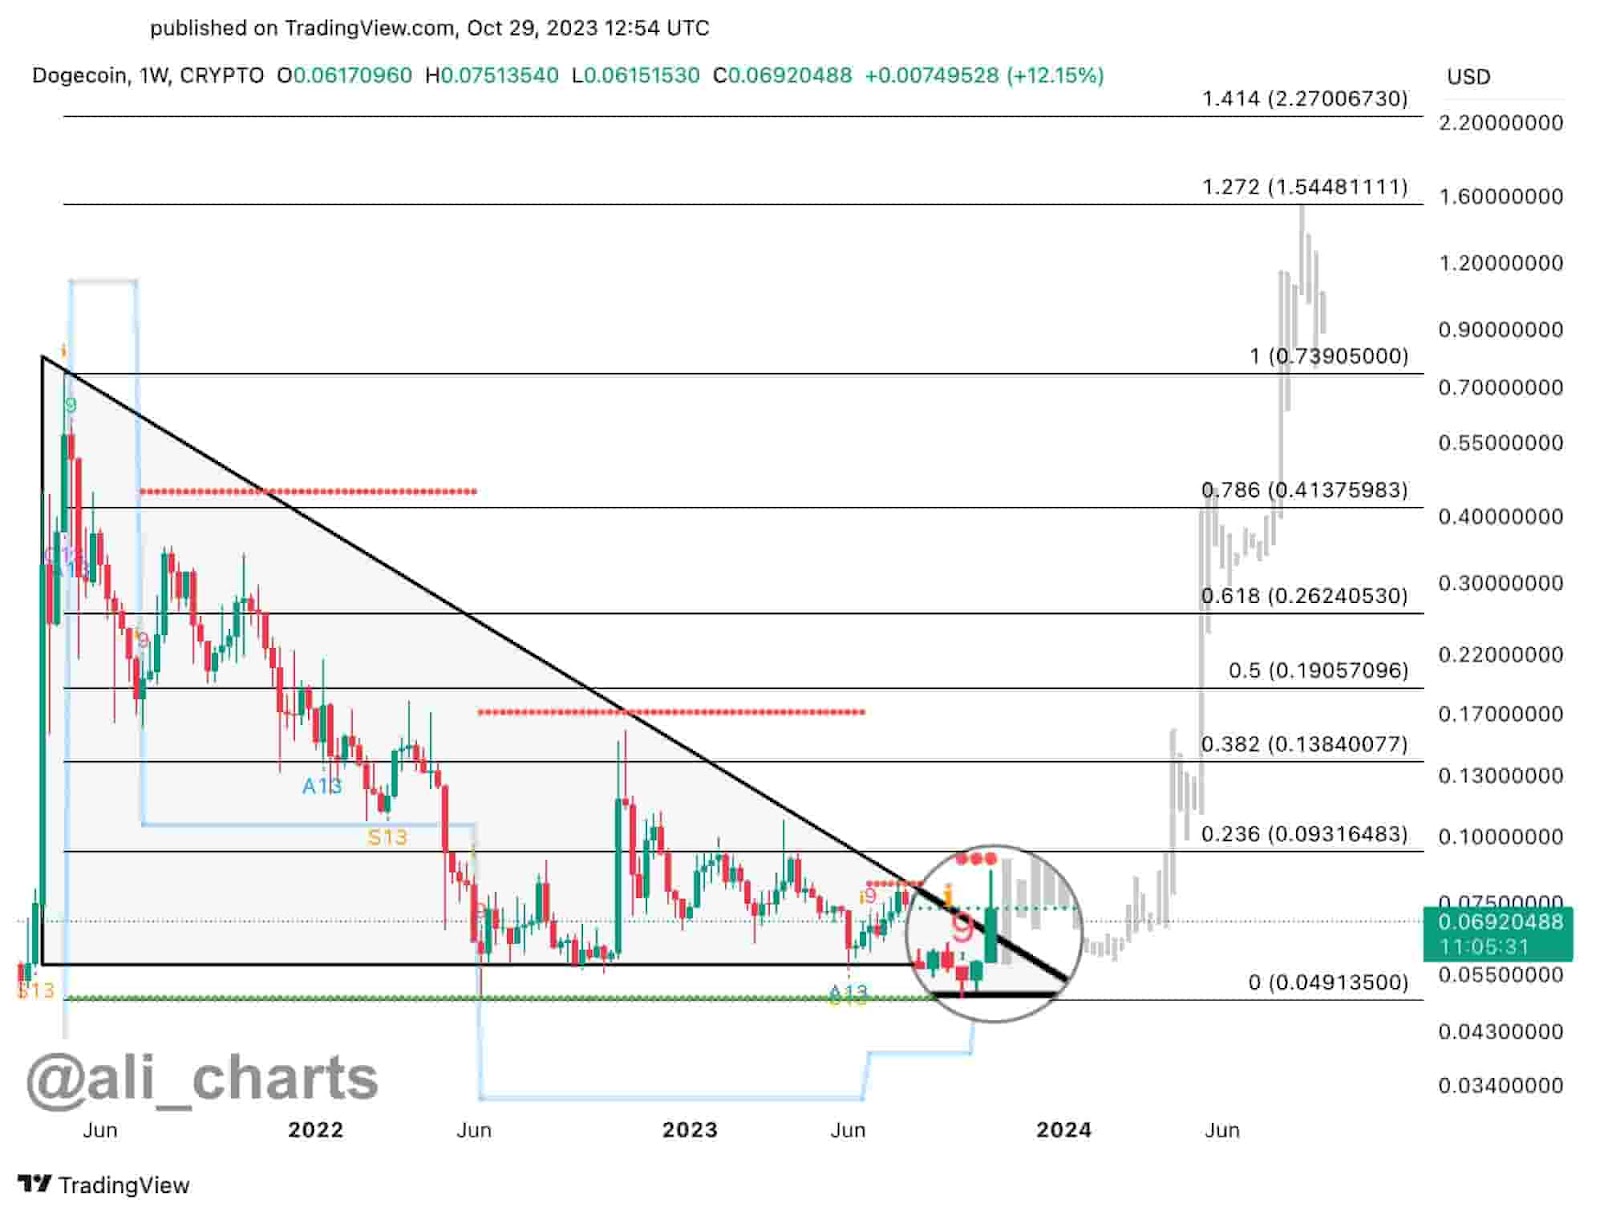
As can be seen from the above chart, DOGE has been stuck in a descending triangle formation since around May 2021 and has managed to ‘escape’ with the latest rally.
A descending triangle is a bearish chart pattern in technical analysis. It typically indicates a continuation of a downtrend and suggests that the price is more likely to break down below the support line than to break upward through the resistance line.
As per Martinez, the breakout confirms the buy signal that was previously flashed by the TD Sequential Indicator, reinforcing the “bullish outlook” for DOGE.
DOGE price analysis
At the time of publication on October 30, DOGE was sitting at $0.069, up 0.94% in the past 24 hours.
The meme cryptocurrency gained around 7% on the week and more than 12.5% on the monthly chart, adding $1.1 billion in market cap during this run.
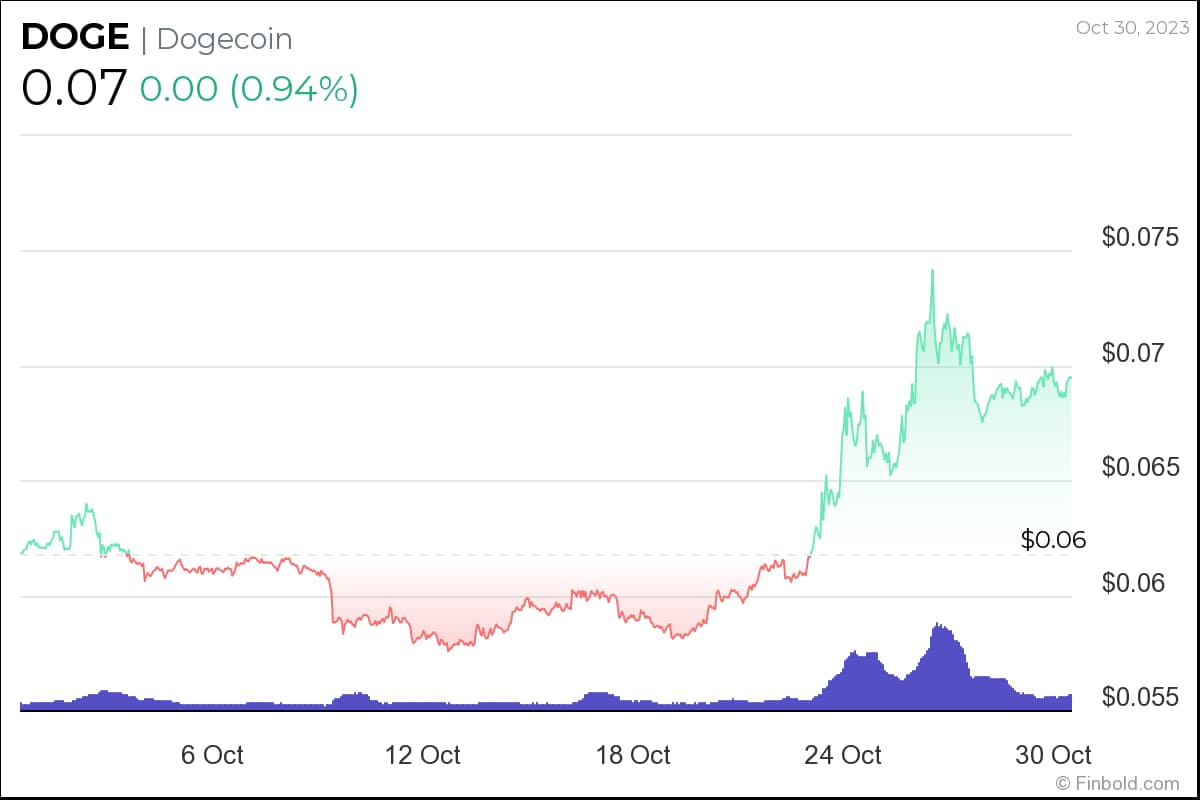
At its current price, Dogecoin is trading above the 200-day moving average (DMA), which is located at $0.068. This price level, and the 100-DMA at $0.065, act as support thresholds for DOGE.
On the upside, the cryptocurrency faces resistance at $0.071 and $0.077 price points, indicating zones where selling pressure could increase.
Disclaimer: The content on this site should not be considered investment advice. Investing is speculative. When investing, your capital is at risk.