
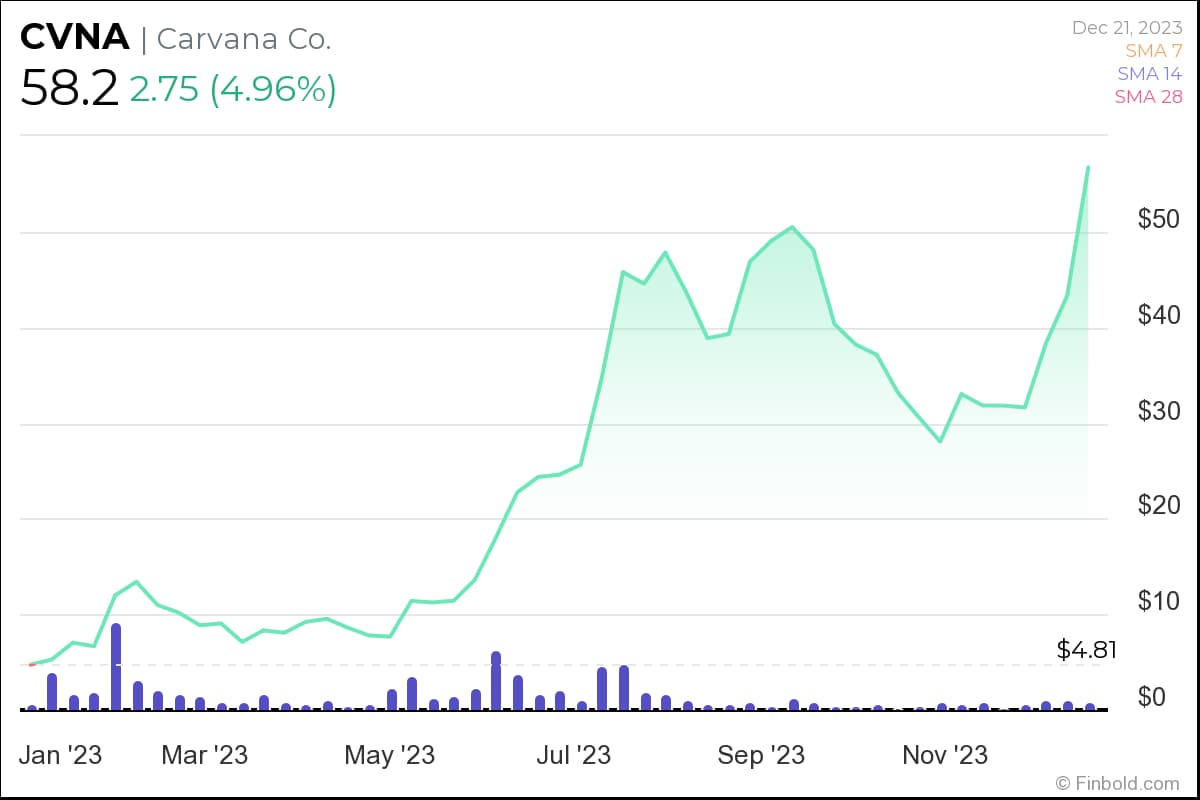
1,160%. That’s how much shares of used car retailer Carvana (NYSE: CVNA) skyrocketed in 2023 – from $4.6 to $58.2 at the time of publication on December 21.
Although the company did report some positives in its recent quarterly reports, this meteoric rise is largely attributed to the so-called “short squeeze.” This refers to a phenomenon when a stock’s price rapidly rises, forcing investors who had bet against (shorted) the stock to buy it to cover their losses, amplifying the upward price movement.
Given that CVNA is one of the most shorted stocks out there (34.6% of its float), it wasn’t very difficult for retail investors to put pressure on short sellers.
Up 87% in a month
Although its 2023 ride was not without its bumps, Carvana’s stock maintained its upward momentum in recent weeks.
The stock is up around 87% in the past month, and a portion of these gains can be attributed to recent positive comments from JPMorgan analysts. Notably, the experts upgraded CVNA to ‘Neutral’ from ‘Underweight’ earlier this month and raised the price target on the stock by 60% to $40 from $25.
The move came as JPMorgan was pleased with the retailer’s progress in productivity, costs, and culture, arguing that those developments put the company in a more favorable position for returning to growth, as compared with 2019-20.
Additionally, the stock benefited from the recent data from the US Census Bureau, which showed that sales in the auto dealer category rose 5.8% year-over-year in November.
Another short squeeze incoming?
In a December 21 post, X account providing a technical analysis (TA) for stocks, TrendSpider, posted a Carvana chart titled “Squeeze inbound?” hinting that another rapid ascent may be in the cards.
The chart specifically indicates that CVNA’s price action may be forming the so-called “inverse head and shoulders” – a chart pattern typically seen as a bullish reversal signal.
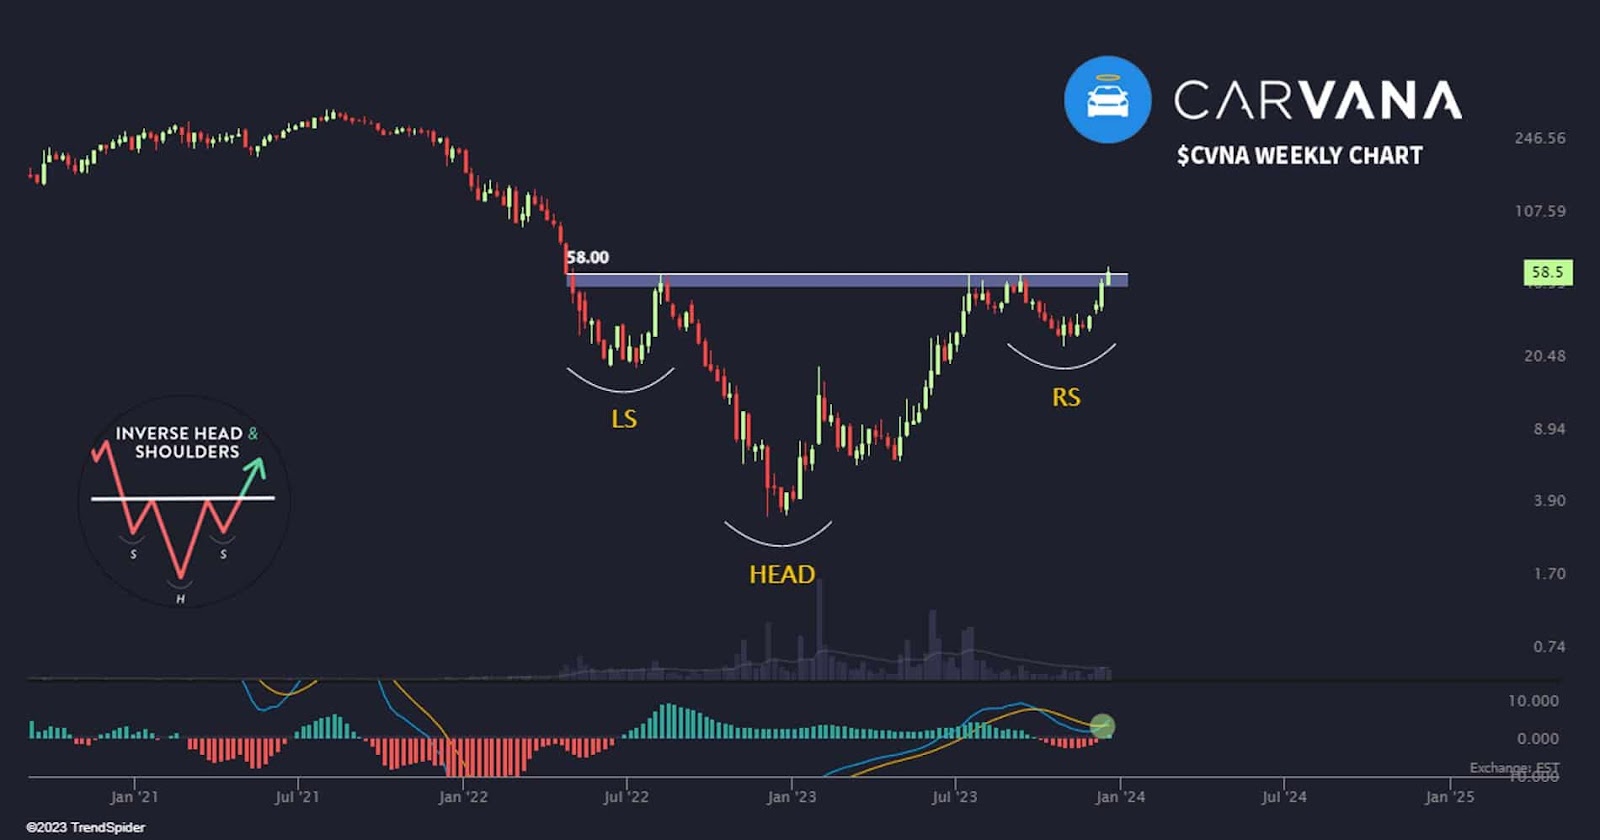
The pattern is complete when the price breaks above the neckline, which connects the highs of the two lower lows.
However, it is important to note that the inverse head and shoulders pattern itself doesn’t directly signal a short squeeze. This formation primarily indicates a potential trend reversal from bearish to bullish. However, in certain situations, the completion of an inverse head and shoulders pattern can lead to increased buying activity and potentially trigger a short squeeze.
Buy stocks now with Interactive Brokers – the most advanced investment platform
Disclaimer: The content on this site should not be considered investment advice. Investing is speculative. When investing, your capital is at risk.