Tesla’s (NASDAQ: TSLA) stock has had a strong performance over the recent period, bolstered by a beat on sales and general Wall Street optimism as the Q2 earnings report is scheduled for July 23 after the markets close.
The previous 30 days brought gains of 37.75% to TSLA stock, helping this EV maker finally trade in the green in 2024; the most recent trading session added 5.15%, setting the price at $251.51.
However, the Tesla price chart reveals something more: a potential rare Dragon pattern, which last occurred in 2020 before TSLA shares reached an all-time high of $414.5.
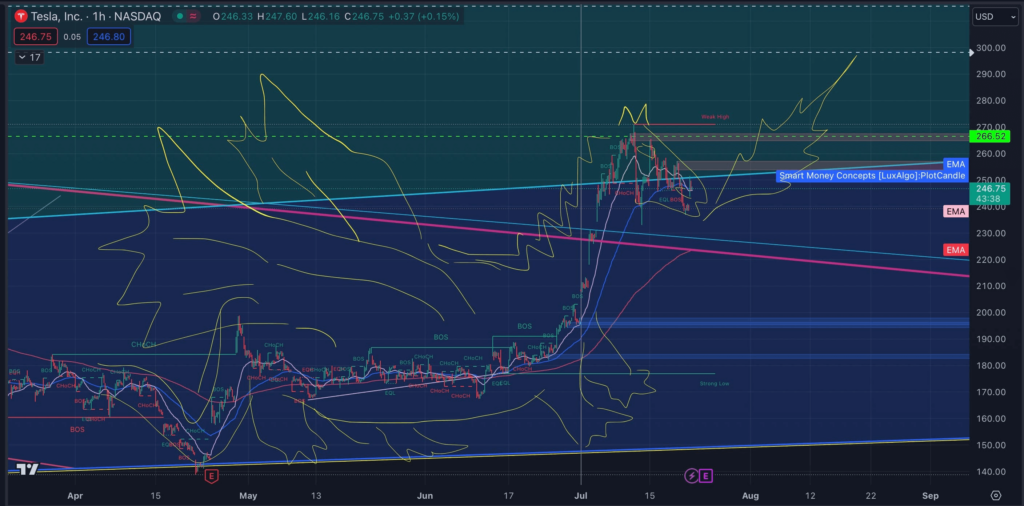
TSLA stock price movement has formed a combination of a double bottom while currently trading above its trend line in what is considered a bullish version of the Dragon Pattern.
This structure suggests a bullish reversal from the recent downtrend. Key indicators include the Exponential Moving Averages (EMA), with the 50 EMA (blue) and 200 EMA (red) converging, a common precursor to significant price movements.
The current price consolidation near the resistance level of $266.52 is crucial. A breakout above this resistance, confirmed with increased trading volume, would validate the dragon pattern, indicating a potential upward trend continuation.
For an effective trading strategy, place stop-losses below recent lows around $220 to mitigate risk, and project target prices by measuring the pattern’s height (distance from trough to peak) to estimate the potential upward movement, potentially aiming for levels above $300.
What is the Dragon pattern?
The Dragon Pattern is a straightforward technical analysis tool that indicates reversal price models and predicts future market trends. It comprises five elements: a head, two feet, a hump between the feet, and a tail.

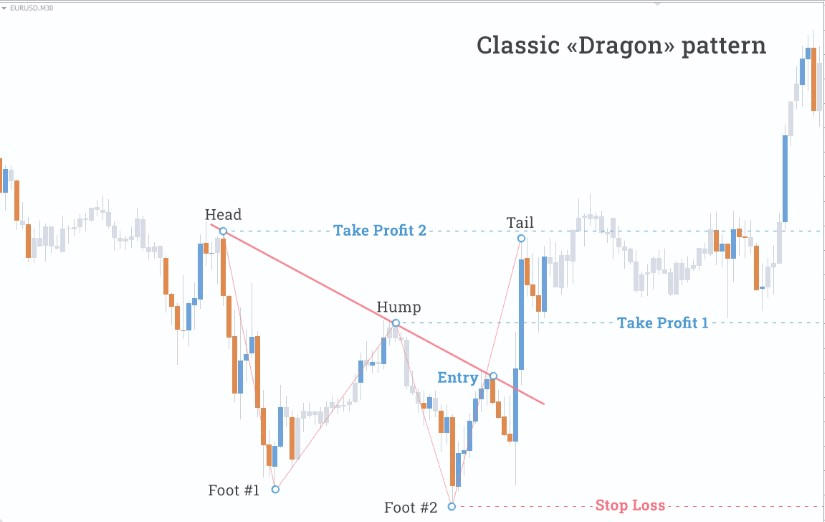
This pattern can signal both bullish and bearish trends, with trading rules being similar for both. According to the classic strategy, drawing a trend line from the head to the hump’s peak allows traders to enter the market when the price crosses this line.
Meanwhile, Elon Musk doubles down on Humanoid robots
Tesla shares rose over 5% on July 22, ahead of the company’s earnings report, as CEO Elon Musk announced plans to produce humanoid robots for internal use by 2025.
Musk has mentioned that Tesla’s humanoid robot, Optimus, is currently performing simple factory tasks in the lab and is expected to be in Tesla’s factories by the end of 2024, with potential external sales by the end of 2025.
However, Tesla has a track record of missing ambitious deadlines, such as the anticipated Robotaxi launch.
Buy stocks now with eToro – trusted and advanced investment platform
Disclaimer: The content on this site should not be considered investment advice. Investing is speculative. When investing, your capital is at risk.