
Ethereum’s (ETH) market dynamics are indicating a notable recovery following a recent downturn driven by fear.
After a sharp decline that pushed ETHUSDT below the $2,000 mark, the bulls have regained control, lifting the price back above $2,500.
In this context, trading expert RLinda projected on August 11 that this recovery phase, despite recent volatility, shows a resilient bullish outlook for Ethereum. Further, it is supported by a promising technical setup visible on both weekly and monthly chart patterns.
Ethereum daily chart pattern – Key resistance levels in focus
According to the analyst, on the daily chart, Ethereum is confronting a critical resistance zone between $2,717 and $2,817.
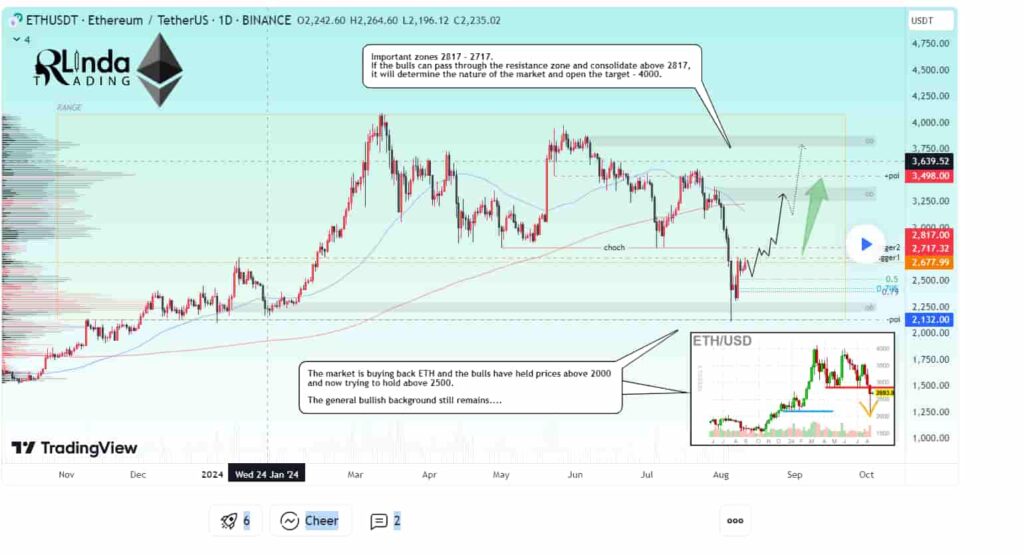
This area has been tested multiple times, with each rejection met by strong buying pressure around the $2,500 level, suggesting that bulls remain firmly in control.
However, the chart still looks bearish, as the price has struggled to break through key resistance levels, maintaining a pattern of lower highs.
Holding above $2,500 is crucial for maintaining the current bullish momentum. If Ethereum breaks through this resistance, the next major hurdle would be around $3,500, potentially paving the way toward the $4,000 mark.
Additionally, the daily chart reveals a “change of character” (CHOCH) pattern, indicating a possible shift from a bearish to a bullish market structure, which could further support a significant upward move.
Ethereum’s long-term support and potential upside
The weekly chart offers additional context, showing Ethereum trading around the 50-week moving average, a historically strong support level. The 200-week moving average, at approximately $2,156, also serves as critical long-term support.
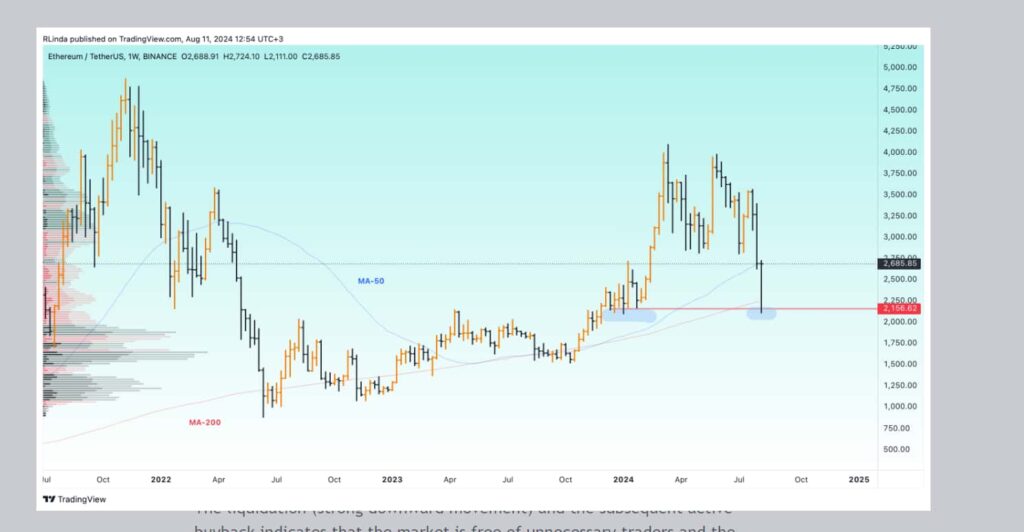
Therefore, the recent bounce from this area suggests that Ethereum could be on the verge of re-entering a global sideways range that has defined its trading behavior for much of the past year.
A break and consolidation above the $2,717 to $2,817 resistance zone could trigger a substantial rally, with potential targets ranging from $4,000 to $4,800.
Support levels to watch are $2,518, $2,425, and $2,400, while the key resistance levels remain at $2,717 and $2,817.
The price action around these levels will determine the next phase of Ethereum’s market trajectory. The volume profile on the weekly chart indicates significant accumulation in this price range, signaling continued confidence among large investors.
The recent liquidation event, followed by a swift recovery, further supports a bullish outlook, suggesting that the market is poised to move higher if key resistance levels are breached.
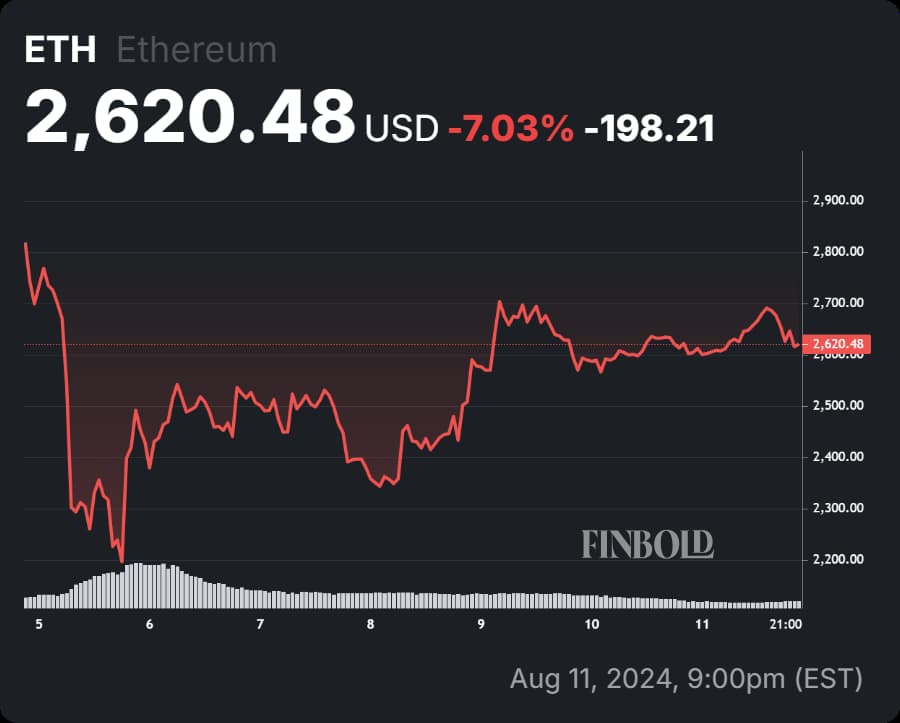
Ethereum price analysis
Currently, Ethereum is trading at $2,620, reflecting a 0.82% increase in the last 24 hours and an accumulated loss of 9% over the past seven days, according to data as of August 11.
For traders and investors, the focus remains on the $2,717 to $2,817 resistance zone. A successful breakout above this level could pave the way for Ethereum to reach new highs, with $4,000 being a realistic near-term target.
However, if the bulls fail to clear this resistance, a pullback toward the $2,500 support level could occur.
While the overall technical structure suggests that Ethereum is positioned for a significant move, the bearish chart elements highlight the importance of overcoming key resistance levels to sustain the bullish momentum and propel the cryptocurrency to new heights.
Disclaimer: The content on this site should not be considered investment advice. Investing is speculative. When investing, your capital is at risk.