
Ethereum’s (ETH) long-term valuation model, the Rainbow Chart, points to a broad but structured price range by January 31, 2026, based on its historical growth curve and logarithmic trend bands.
Notably, the chart maps Ethereum’s price action across color-coded valuation zones designed to capture market psychology rather than provide precise price forecasts.
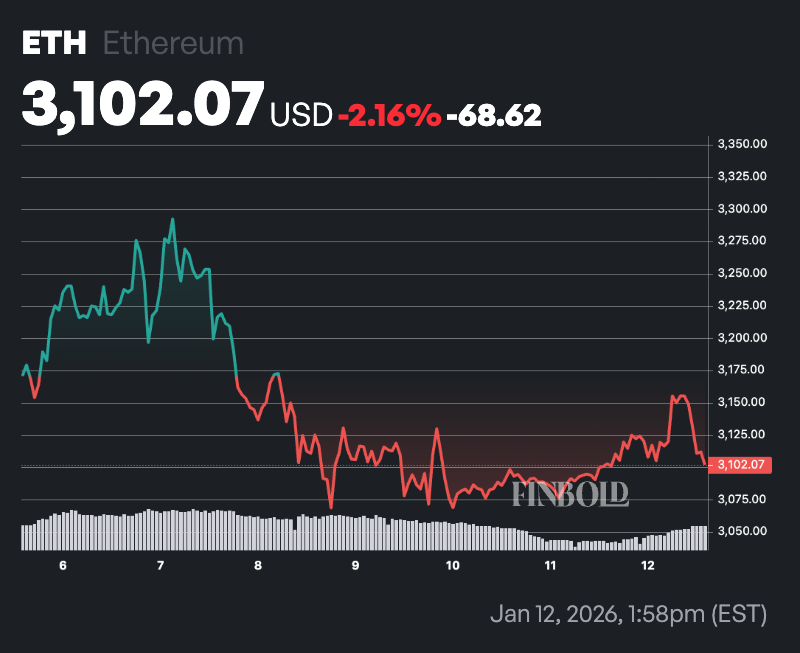
Indeed, the model’s outlook comes as Ethereum trades just above the $3,000 support level. As of press time, the asset was valued at $3,102, down less than 0.1% in the past 24 hours, while on the weekly timeline, ETH was down over 2%.
This price range places the second-ranked cryptocurrency by market cap in the lower-middle portion of the Rainbow Chart, a region typically associated with accumulation and undervaluation narratives.
From this starting point, the model outlines multiple valuation bands that ETH could occupy by the end of January 2026, depending on market momentum, adoption trends, and broader macro conditions.
Ethereum price prediction
At the base of the model is the ‘Fire Sale’ band, historically associated with extreme pessimism and capitulation, which for January 31, 2026, spans roughly $993 to $1,339 and would imply a sharp breakdown from current levels. Just above it, the ‘Undervalued’ band ranges from about $1,339 to $1,842, indicating Ethereum trading below its long-term trend as patient investors begin to re-enter.
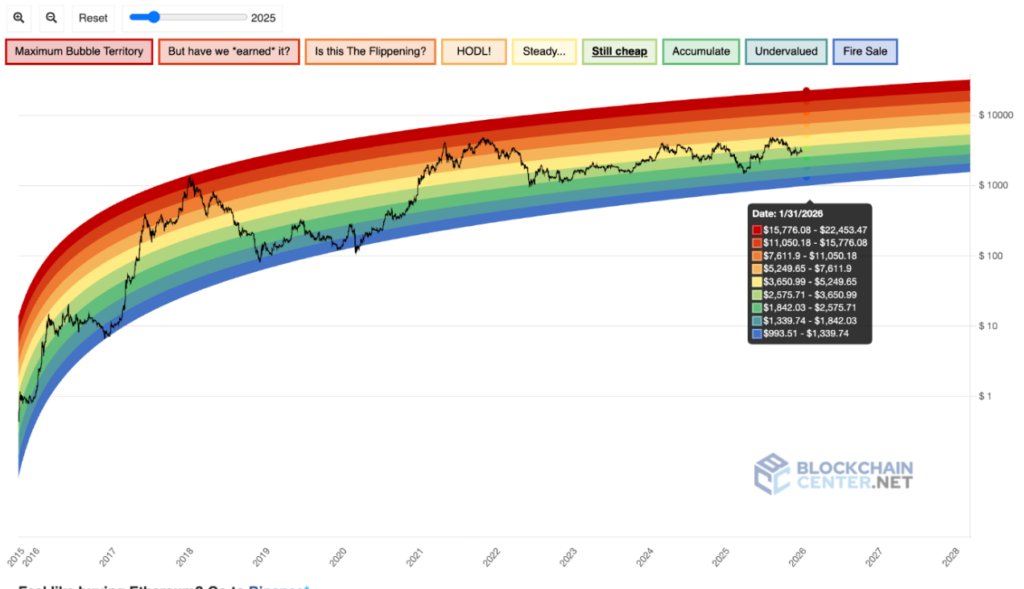
The ‘Accumulate’ band projects a range of about $1,842 to $2,576, signaling improving sentiment with continued caution typical of early recovery phases. Above it, the ‘Still Cheap’ band spans roughly $2,576 to $3,650, pointing to modest gains from current levels and a market that recognizes Ethereum’s value without excess optimism.
The ‘Steady…’ band, ranging from about $3,650 to $5,250, reflects balanced conditions where price growth closely tracks Ethereum’s long-term adoption trend, suggesting a mature uptrend.
Above that, the orange ‘HODL!’ band spans roughly $5,250 to $7,612, reflecting strong bullish conviction driven by long-term holders and limited selling pressure. The darker orange ‘Is This
Ethereum bullish phase
The Flippening?’ band follows at about $7,612 to $11,050, signaling heightened optimism and speculative interest around Ethereum’s growing market influence.
Near the top, the red-orange ‘But have we ‘earned’ it?’ band ranges from approximately $11,050 to $15,776, indicating stretched valuations and sustainability concerns. The ‘Maximum Bubble Territory’ band caps the model at roughly $15,776 to $22,453 by January 31, 2026, a zone historically linked to euphoric conditions and major corrections.
Given Ethereum’s current price of $3,102, the model implies that remaining within the ‘Still Cheap’ or ‘Steady…’ bands would require moderate appreciation, while a move into the higher orange and red zones would signal a powerful bull cycle.
Featured image via Shutterstock