
The Ethereum Rainbow Chart, a logarithmic regression model designed to track Ethereum’s (ETH) long-term growth trajectory, has outlined a projected price spectrum for September 30, 2025.
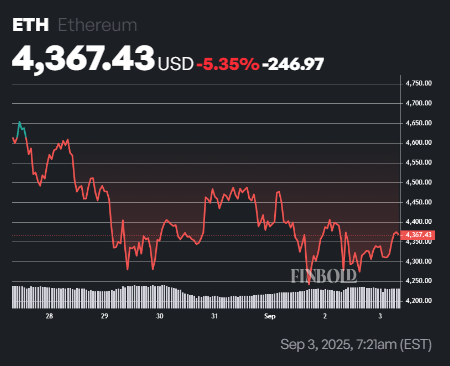
The outlook comes as Ethereum attempts to reclaim recent highs, with the second-ranked cryptocurrency by market cap having reached a record price of nearly $5,000.
According to the chart, Ethereum could trade as low as $1,947 if it falls into the ‘Fire Sale’ zone, or climb as high as $21,101 if it enters ‘Maximum Bubble Territory.’
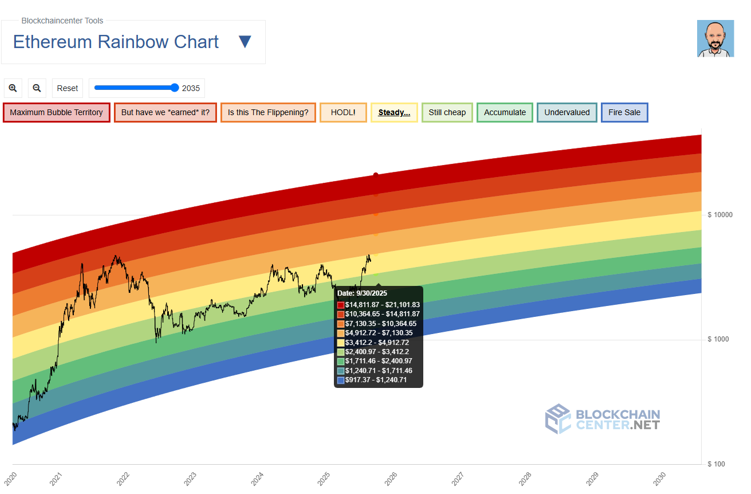
Between these extremes, the bands define different stages of sentiment: $2,401 in the ‘Undervalued’ zone, $2,849 in the ‘Accumulate’ zone, $3,402 in the ‘Still Cheap’ zone, and $4,117 in the ‘Steady’ band. Higher up the scale, Ethereum would be valued at $4,912 in the ‘HODL’ zone, $5,913 in the ‘Is this the Flippening?’ band, and $7,304 in the ‘But have we earned it?’ level.
ETH price analysis
Currently, Ethereum is trading at $4,380, placing it in the ‘Steady’band of the Rainbow Chart. This suggests that if the cryptocurrency maintains its current positioning relative to the model, it could remain within the Steady or HODL range by the end of September 2025.
However, stronger bullish momentum could drive it toward the Flippening or even speculative bubble levels, while downside pressure could push it back into accumulation or undervaluation zones.

While not a short-term predictive tool, the Rainbow Chart provides a long-term framework for investors to assess Ethereum’s growth path. Ethereum’s price trajectory also remains closely tied to broader market movements, as it tends to trade in correlation with other digital assets.
At the same time, for ETH to target higher values, significant capital inflows, particularly through exchange-traded funds (ETFs), would be required.
In this regard, the asset is attracting growing interest from major firms such as BlackRock, which has accelerated its Ethereum purchases in 2025, outpacing its Bitcoin acquisitions.
Featured image via Shutterstock