

Tesla (NASDAQ: TSLA) stock could be approaching another major bullish expansion, according to technical analysis by TradingShot.
In a TradingView post on October 12, the analyst identified similarities between Tesla’s current long-term chart and the setups that preceded its previous major rallies.
TradingShot’s monthly chart projects a potential Tesla stock price target of $2,000 between 2028 and 2030, provided the stock maintains its ascending channel dating back to its June 2010 initial public offering.
The analyst divided the channel into green buy, blue intermediate, and red sell zones, using Fibonacci levels to identify potential support and resistance.
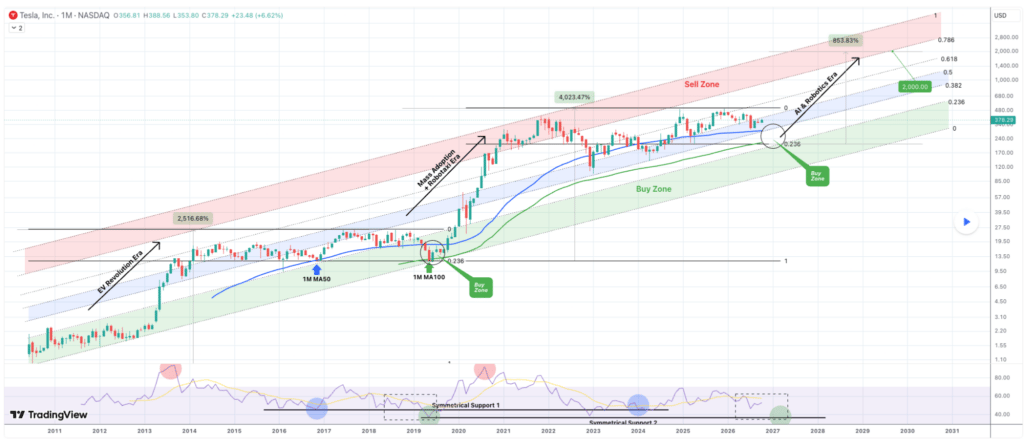
TradingShot identified two major historical rallies: a 2,516% gain between 2012 and 2014, driven by growing electric vehicle adoption and the Model S, and a 4,023% surge between 2019 and 2021, amid expanding Model 3 and Model Y production, improving profitability and rising expectations for autonomous driving.
Both rallies approached the channel’s upper boundaries. The analyst sees AI, autonomous driving, Robotaxis and Tesla’s Optimus humanoid robot as potential catalysts for another expansion.
Before that rally, the analyst identified a potential buying zone between $210 and $250, aligning with the channel’s lower Fibonacci region and the projected position of the 100-month moving average (MA) in early 2027.
Tesla stock technical analysis
At the same time, TradingShot drew a parallel with June 2019, when TSLA shares reached the 100-month moving average and the lower boundary of the ascending channel. The price also aligned with the 0.236 Fibonacci level before the stock began its powerful 2020–2021 rally.
The analyst suggested a similar combination of technical support could emerge in the coming months, potentially establishing another long-term bottom.
The monthly relative strength index (RSI) provides an additional signal. TradingShot pointed to a historical support levels on the momentum indicator that coincided with significant bullish reversals. A return toward the lower symmetrical support could therefore accompany another long-term turning point.
However, the projected pullback is not guaranteed, and Tesla does not necessarily have to repeat the magnitude of its previous rallies. A sustained break below the ascending channel’s lower boundary would weaken the bullish outlook.
AI and robotics could drive Tesla toward $2,000
The forecast suggests Tesla’s major rallies have coincided with shifts in investor expectations, from electric vehicles in 2012–2014 to mass-market production and autonomy in 2019–2021. The next potential expansion, projected for 2027–2030, would center on AI and robotics.
Under this scenario, Tesla could rebound from the channel’s lower Fibonacci region toward its upper boundaries. The $2,000 target aligns with the 0.786 Fibonacci level near the lower edge of the channel’s red sell zone.
From a potential bottom of around $210, the target would represent a gain of approximately 850%, requiring significant progress in Tesla’s autonomous driving and robotics businesses.
The expert also raised the possibility of a future Tesla-SpaceX merger, although no such transaction is confirmed.
Featured image via Shutterstock