
Every trader, at some point, experiences the pain and frustration of watching a stock take off without them, leaving them wondering whether the stock will keep climbing or start to fall. For the trading rookies out there, the dreaded fear of missing out (FOMO) can kick in, driving them to leap into trades too quickly, chasing dreams of overnight riches. Meanwhile, mulling too long over the perfect entry point can just as easily lead to missed opportunities and rueful what-ifs.
Seasoned traders, on the other hand, stick to strict rules based on technical analysis and chart patterns. Among these, the bull flag pattern is a reliable and common tool, useful in everything from minute-long to daily charts.
So, what is the bull flag pattern, how does it form, and how to use it in your trading strategy? Let’s find out!
Picks for you
What does a bull flag look like?
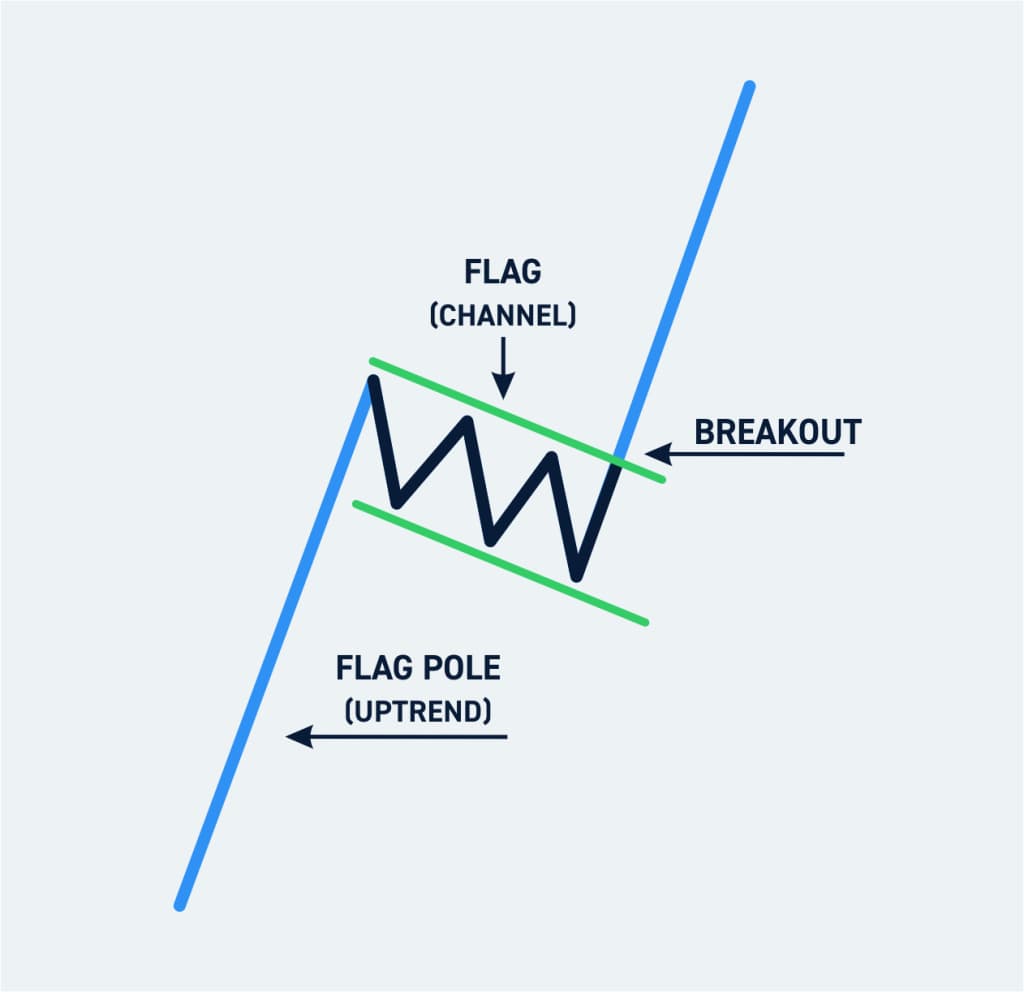
The bull flag pattern appears during a strong upward market trend, characterized by a brief pause or slight pullback in prices following a sharp rise. This pattern is named for its resemblance to a flag on a pole; the initial price surge represents the flagpole, and the consolidating downward trend forms the flag.
Components of the bull flag pattern:
- The pole: Initiated by a strong upward price movement, the pole is marked by significant buying pressure and is usually accompanied by increasing trading volumes, indicating strong investor interest;
- The flag: After the pole’s peak, the price typically consolidates, forming a downward or horizontal sloping channel with reduced volume. This period reflects traders taking profits and less aggressive buying, which appears as a slight pullback or sideways movement in price.
How to trade a bull flag pattern?
To effectively trade a bull flag pattern, traders should focus on a few key aspects:
- Confirmation: The pattern is confirmed when the price breaks out of the flag formation to resume its upward trend. This breakout should be on higher volume, confirming the continued interest and buying pressure;
- Entry point: Traders often enter a trade upon a breakout above the upper boundary of the flag, placing a stop loss just below the flag or at the bottom of the flagpole to minimize potential losses;
- Target price: The expected rise in price after the breakout can often be estimated by the height of the flagpole. Traders might project this height upward from the breakout point to set a target price, offering a clear profit objective.
Recommended video: How to trade the bull flag pattern?
What is the psychology of the bull flag pattern?
The bull flag pattern is deeply rooted in the psychology of market participants. It reflects a battleground of emotions, primarily greed, and fear, which influence trader behavior:
- Greed: The quick price increase initially creates a fear of missing out (FOMO) among investors, leading to a rush to buy stocks. This greed drives the swift upswing in price, forming the pole.;
- Fear: As the prices peak, some investors start fearing a potential downturn, prompting them to lock in gains. This results in the flag portion where the stock price consolidates, and trading volumes diminish as participants assess their next moves.
Conclusion
The bull flag pattern reflects market trends and provides a window into the collective psyche of market participants. It underscores how repeated emotions of fear and greed can shape market dynamics and influence trading decisions.
By understanding and identifying this pattern, traders can spot potential rallies before they unfold, positioning themselves advantageously in a competitive market. As always, remember that while the bull flag can indicate a price increase, it’s crucial to consider other market factors and perform a comprehensive analysis to support trading decisions.
Disclaimer: The content on this site should not be considered investment advice. Investing is speculative. When investing, your capital is at risk.