Throughout history, the stock market has endured its fair share of turbulence and uncertainty. Yet, despite facing occasional bumps on the way, it has consistently shown an upward trajectory in the long run.
This enduring pattern is a testament to the inherent resilience of the stock market, driven by factors such as economic growth, innovation, and the compounding effects of long-term investments.
Over the past 30 years, dozens of stocks made eye-popping returns, meaning that investors who bet on these companies in their earliest days have likely made a fortune.
Interestingly, the stock that made the highest returns during that run was non-alcoholic beverage maker Monster Beverage Corp. (NASDAQ: MNST), followed by Amazon (NASDAQ: AMZN) and Apple (NASDAQ: AAPL), according to a table shared by market strategist Charlie Bilello on November 7.
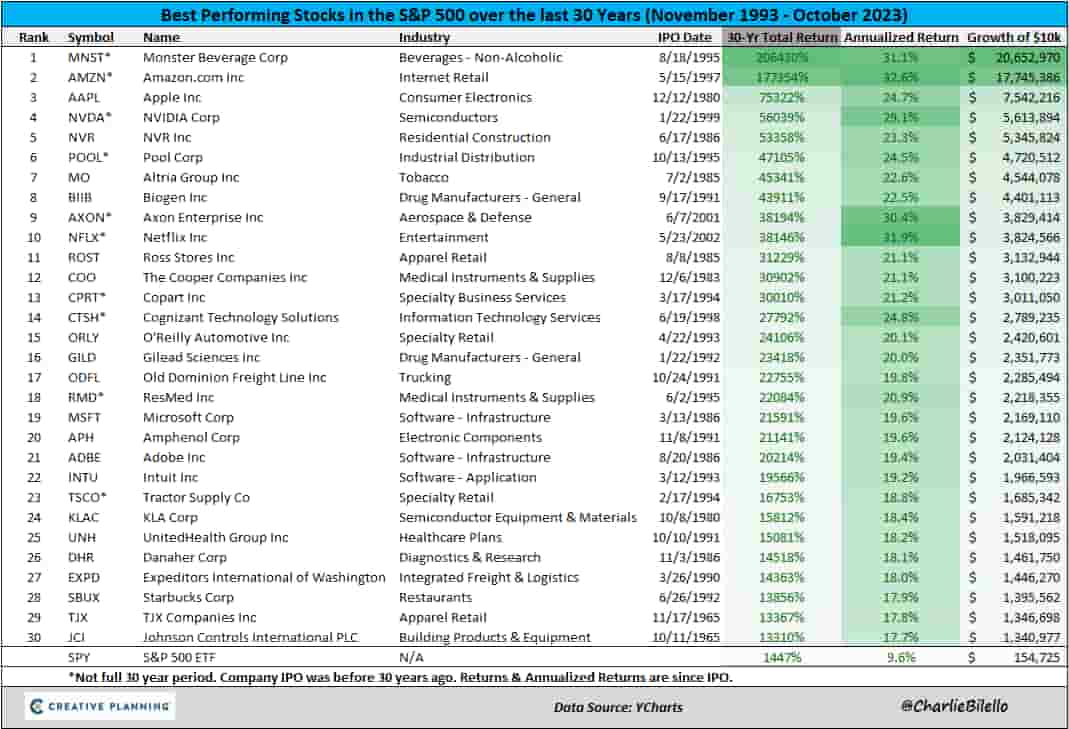
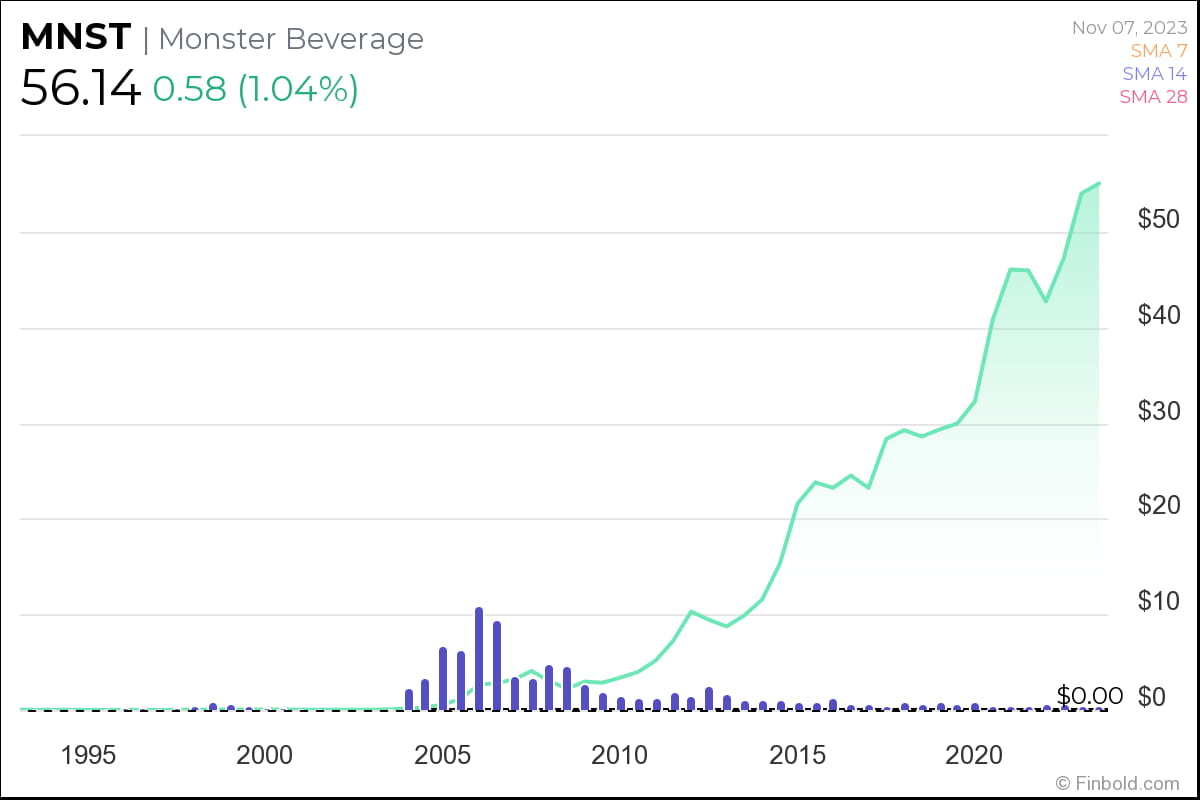
Over the past three decades, MNST shares rocketed more than 206,000% marking an annualized return rate of 31.1%. The stock was trading below $0.1 at its August 1995 initial public offering (IPO). Today, November 7, 2023, it is trading at $56.14.
Apple and Amazon in the top 3
The second-best performing stock over the past 30 years is e-commerce and cloud computing giant Amazon. Founded by American entrepreneur Jeff Bezos, AMZN became a publicly listed company in May 1997 at an IPO price of $18 per share.
Since then, AMZN shot up more than 177,000% to its current share price of $139.74.
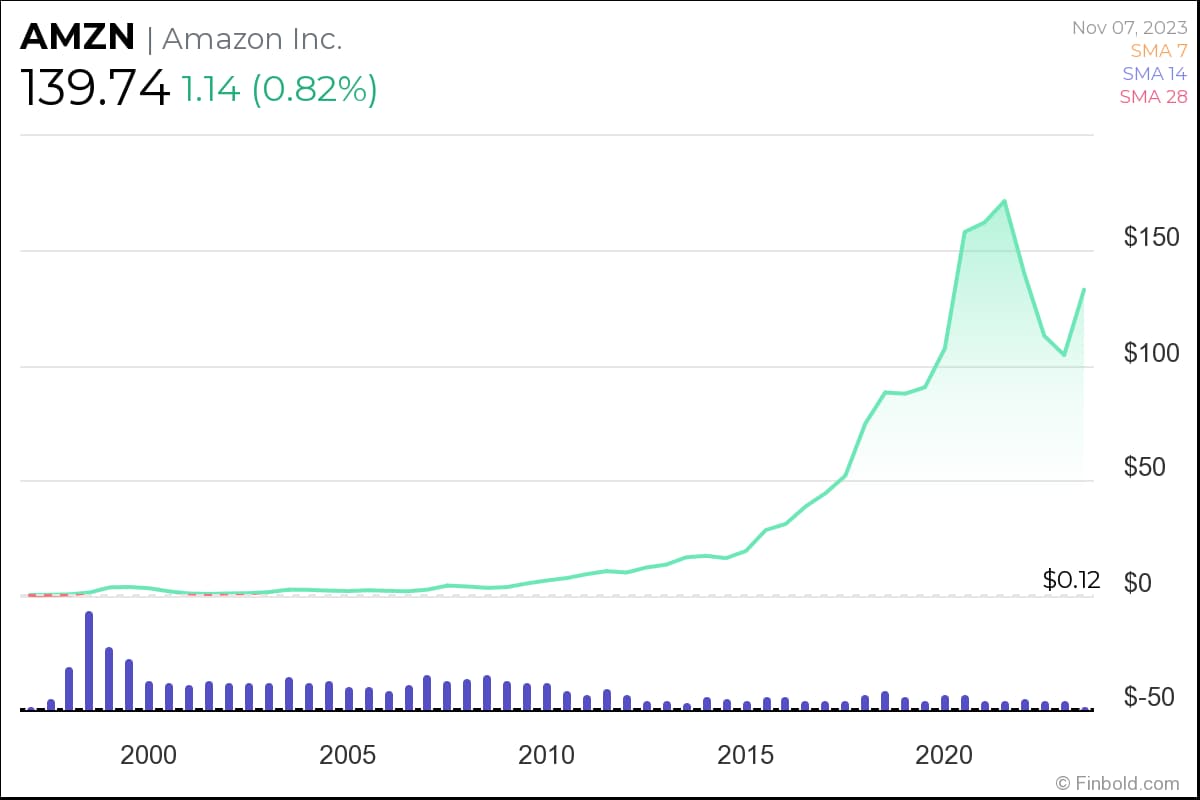
The stock’s annualized return rate over this period was 32.6%, higher than Monster’s.
Unsurprisingly, the US-listed stock that saw the highest stock price growth after MNST and Amazon is Apple. Seen as one of the leaders of the tech revolution over the past three decades, AAPL’s earliest investors enjoyed a 30-year total return of more than 75,000%.
The iPhone maker, which was trading at below $0.3 in November 1993, currently sits at $179.23 and is the world’s most valuable company with a market cap of $2.8 trillion.
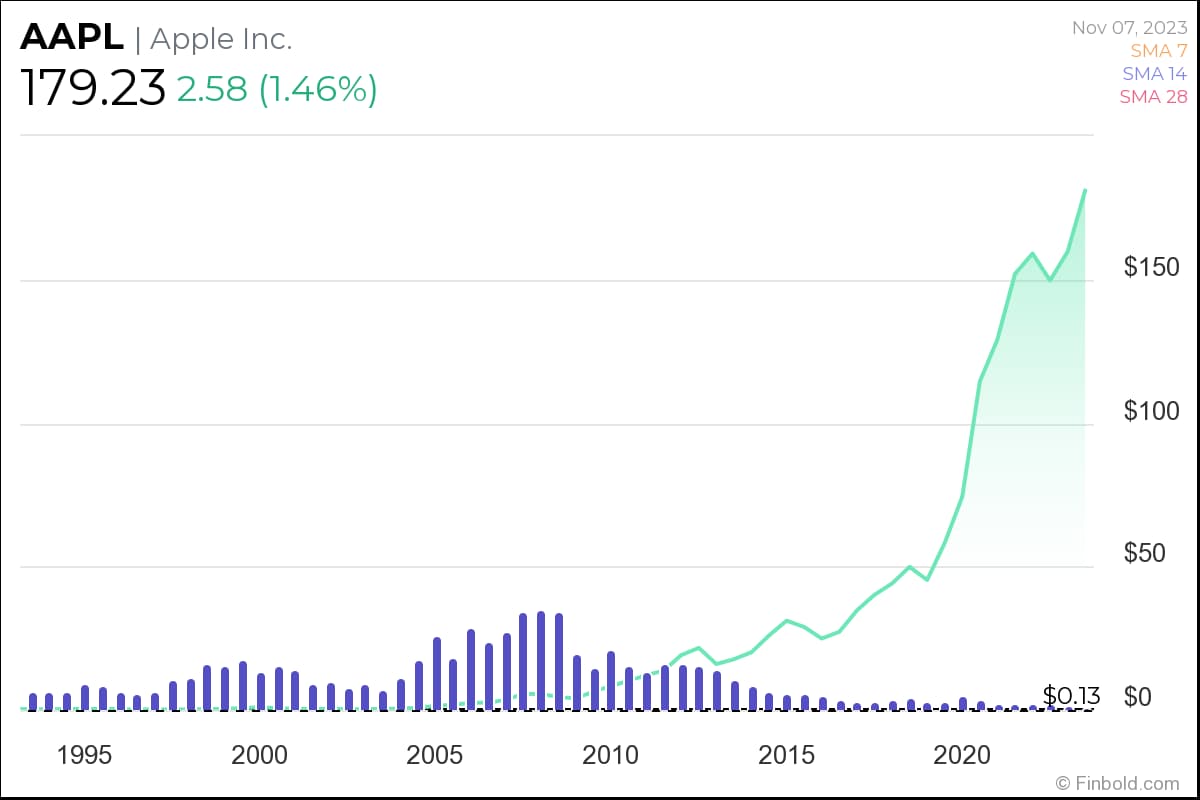
The annualized growth rate of Apple’s shares since November 1993 was 24.7%.
Meanwhile, Nvidia (NASDAQ: NVDA) and home construction company NVR Inc (NYSE: NVR) jumped more than 56,000% and 53,000%, respectively, rounding up the top 5 companies by stock price returns over the past three decades.
Other well-known companies showcased by Bilello’s table include Netflix (NASDAQ: NFLX), Microsoft (NASDAQ: MSFT), Adobe (NASDAQ: ADBE), and Starbucks (NASDAQ: SBUX), among others.
Buy stocks now with Interactive Brokers – the most advanced investment platform
Disclaimer: The content on this site should not be considered investment advice. Investing is speculative. When investing, your capital is at risk.