Solana (SOL) is an inflationary cryptocurrency, which means its circulating supply increases over time, diluting its price. These economics are by the protocol’s design; thus, investors must understand how it affects their holdings and decisions.
Notably, there is no consensus on the exact yearly inflation rate for Solana or other cryptocurrencies. Data may vary from each source’s definition of inflation or circulating supply.
First, the Solana Foundation considers only the issuance of new tokens to pay the network’s staking validators as inflation. Solana Labs has a similar understanding, according to its documentation.
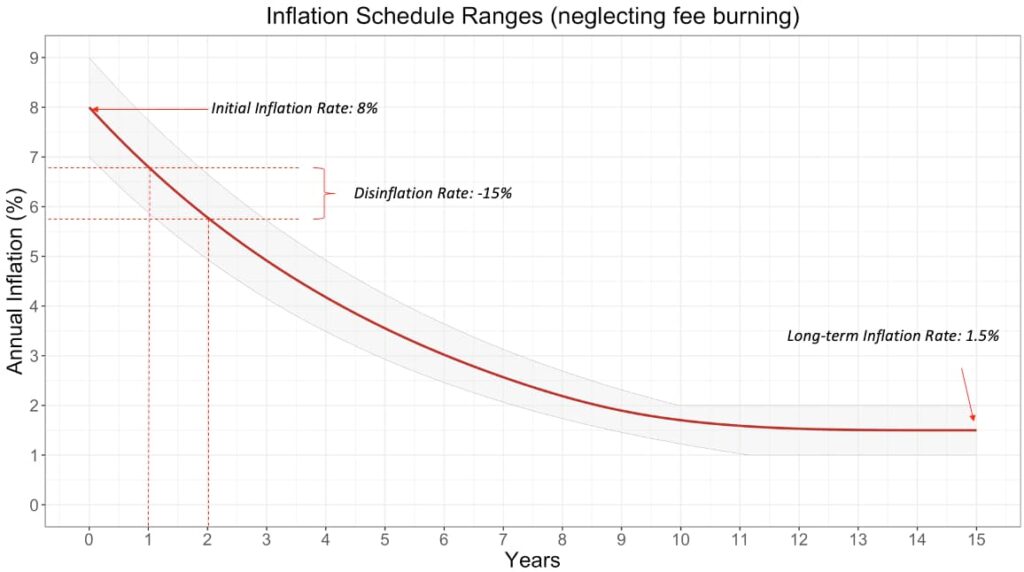
Additionally, the project’s documentation mentions a yearly disinflation rate of around 15%. As stated by the two core entities behind the project, its issuance rate started at 8% by launch, following what they call an “inflation schedule,” resulting in long-term forecasted supply inflation of 1.5%.
Interestingly, SOL would have a yearly inflation rate of approximately 5.5% on February 7 if we only consider issuance.
Solana effective circulating supply yearly inflation rate
However, CoinCodex’s and Messari’s data show a significantly higher yearly inflation rate by looking at the effective circulating supply increase. These platforms may consider SOL unlocks by the team, advisors, seed investors, and other entities who received Solana from the initial arbitrary token distribution.
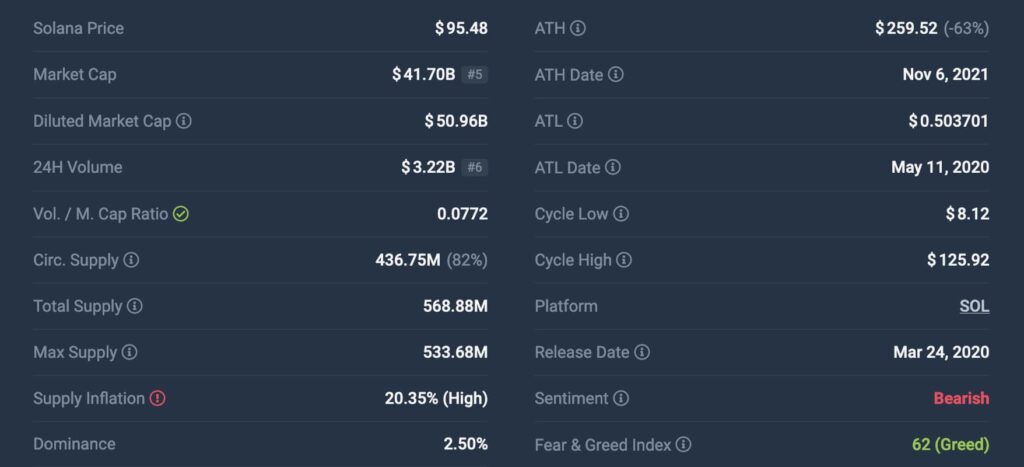
For example, CoinCodex sets a 20.35% yearly supply inflation for Solana at the time of publication.
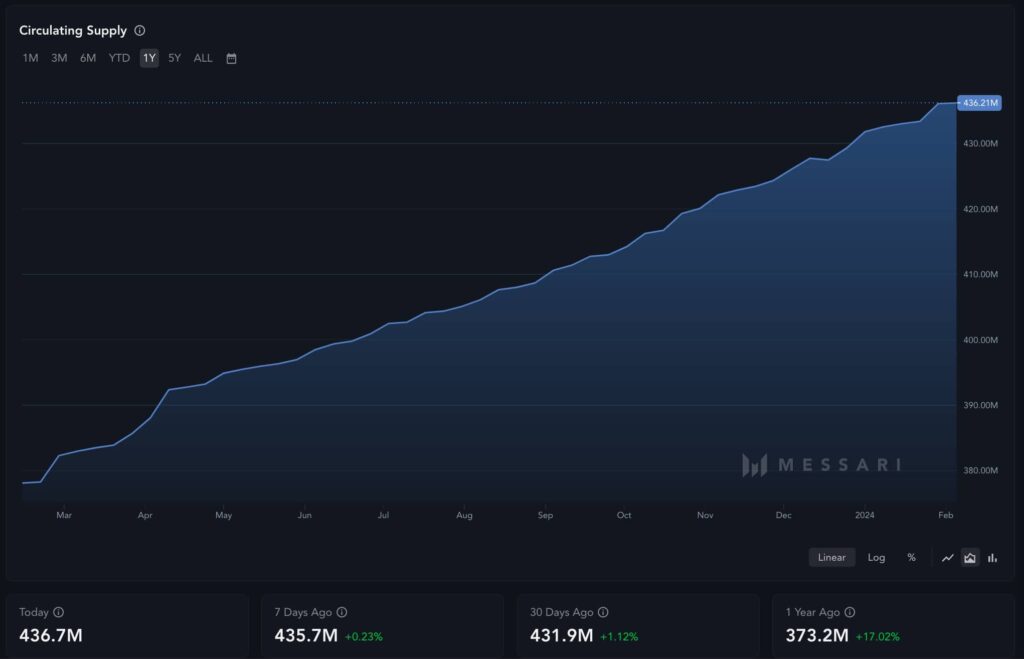
In the meantime, Messari’s chart shows a 17.02% yearly increase in SOL’s circulating supply.
This is important because the real economic effects of inflation are related to price dilution and sell-off pressure. Supply vs. demand dynamics directly affect price formation and fair value discovery. Therefore, looking at the effective circulating supply is fair when measuring Solanas’s real yearly inflation rate.
All in all, Solana has a relatively high yearly supply inflation rate compared to most highly capitalized cryptocurrencies. This could be a net negative for SOL investors if the digital asset does not gather enough demand for the token.
In particular, Finbold reported that Solana would trade at $191.34 with November’s 2023 circulating supply if it reached its all-time high market cap that priced SOL at $260.06 in 2021. A loss of $68.72 (26.4%), similar to the real yearly supply inflation rate estimations.
Disclaimer: The content on this site should not be considered investment advice. Investing is speculative. When investing, your capital is at risk.