
Dogecoin (DOGE), the popular meme cryptocurrency, has shown a remarkable performance with a weekly gain of 6%. Combining key bullish aspects like market cycles, breakouts, sentiment, and market structure, DOGE is preparing for a major move higher.
An analysis shared by TradingShot on TradingView on July 24 highlights a sequence of technical patterns that historically indicate significant upward movements in Dogecoin’s price.
Historical market phases and patterns
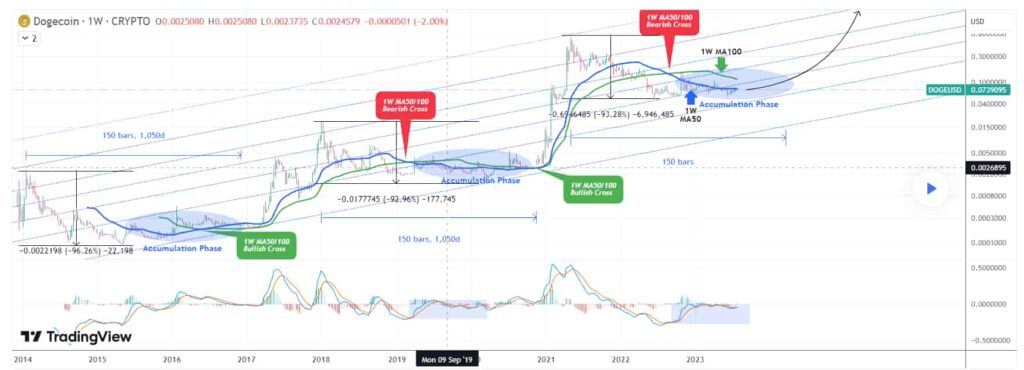
According to his analysis, from 2014 to 2017, Dogecoin experienced an initial decline and accumulation phase.
During this period, the price dropped sharply by 96.26%, bottoming out at around $0.002198. Following this decline, Dogecoin entered a prolonged stabilization phase lasting approximately 1,050 days (150 weeks).
The next significant period was the bullish cross and rally from 2017 to 2018. During this time, the 1-week moving average (MA) of 50 crossed above the 100 MA, signaling a new upward trend. Following this crossover, Dogecoin’s price surged significantly.
However, from 2018 to 2019, Dogecoin entered a bearish cross and decline phase. The 50 MA crossed below the 100 MA, leading to a steep decline of 92.96%. After reaching a bottom, the price stabilized and entered another accumulation phase.
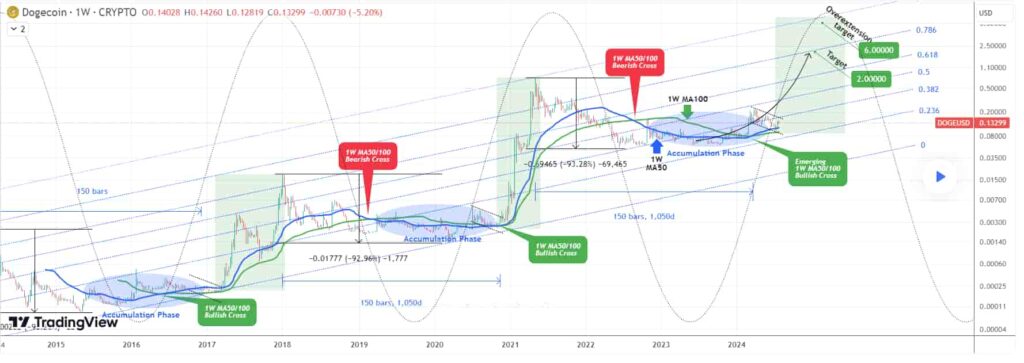
From 2020 to the present, Dogecoin has been in a new accumulation phase. The price has been stabilizing within a defined range, supported by the 50 MA and facing resistance at the 100 MA. This phase resembles the earlier accumulation periods, indicating potential consolidation before another breakout.
Key support and resistance levels
The primary support is provided by the 1-week moving average, which is currently holding strong around the $0.07 to $0.08 range.
This level has been crucial in maintaining the price within the accumulation phase, suggesting an imminent breakout.
Another significant support level is the historical accumulation phase, low around $0.002198, which served as a strong foundation during previous market cycles.
On the resistance, the immediate level to watch is the 0.236 Fibonacci retracement, positioned around $0.20.
This level needs to be surpassed for the bullish momentum to gain strength. Beyond this, the major resistance is identified at the 0.618 Fibonacci level, approximately $2, which aligns with the previous significant highs and could pose a considerable challenge for upward movement.
Additionally, the overextension target is around the 0.786 Fibonacci level at $6, marking a potential peak if the bullish trend continues to accelerate.
Potential buy opportunity
A significant buy opportunity for DOGE is anticipated at the breakout from the current accumulation phase. The primary support level at the 1-week moving average, which is around $0.07 to $0.08, presents an ideal entry point.
Investors looking to capitalize on the expected bullish momentum should consider entering the market around this support range.
Additionally, the current price level of $0.13299 could also be a favorable entry point before the anticipated aggressive rally phase.
Monitoring these levels closely will enable investors to make well-timed entries to maximize potential gains as Dogecoin prepares for a significant upward movement.
Disclaimer: The content on this site should not be considered investment advice. Investing is speculative. When investing, your capital is at risk.