
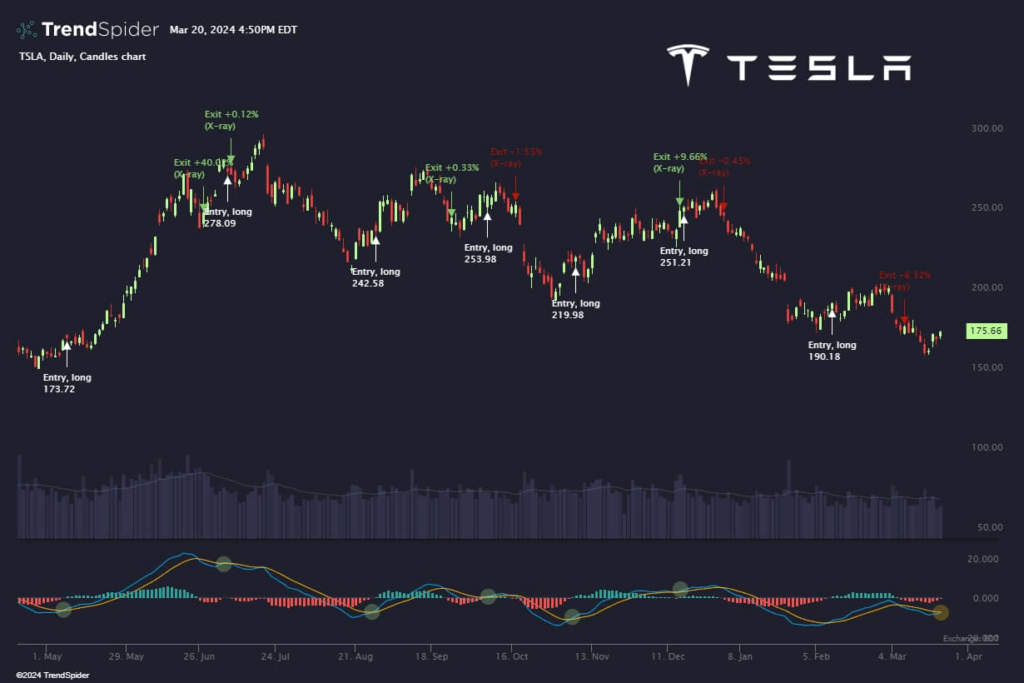
Although 2024 hasn’t been particularly favorable for Tesla’s (NASDAQ: TSLA) stock and its investors, taking a broader perspective reveals a potential silver lining in the form of a strategy that has generated an impressive 1,313% return over the past five years.
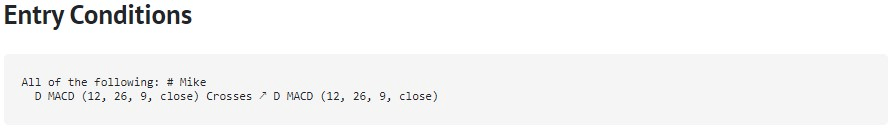
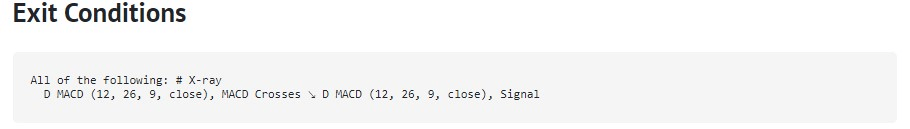
The strategy concerning TSLA involves initiating a long position upon observing a bullish MACD cross and exiting when a bearish MACD cross occurs. The MACD crossover happens when the MACD line intersects with the signal line, typically signaling a shift in market momentum or trend, and vice versa.
Over the past five years, this approach has yielded notable results, including a return of 1,313% compared to an 852% return achieved through a buy-and-hold strategy.
Additionally, the risk-to-reward ratio stands at 4.35, and the average return per position amounts to 25%. Presently, conditions indicate a potential opportunity for another entry, signaling a point of interest for further consideration.
How to set up this TSLA stock strategy?
As entry conditions approach, it’s essential to establish a trading strategy based on a preset that has been rigorously tested on a candlestick chart within a daily time frame setting with a long entry upon observation of a bullish MACD cross.
When it comes to the exit strategy, a slightly different preset is employed upon the appearance of a bearish MACD cross on the price chart.
The real appeal and strength of this strategy lie in its versatility and its ability to be applied across various setups beyond just TSLA stock.
Tesla stock price chart
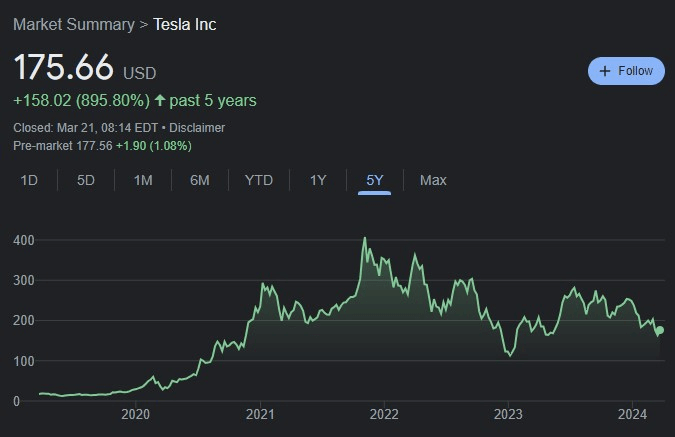
As of the close on March 20, the current price chart positions TSLA stock at $175.66, reflecting a gain of 2.53% in the latest trading session. Over the past five days, TSLA shares have surged by 4.93%.
Since the start of the implementation of the mentioned strategy five years ago, TSLA stock has risen by 895.80%.
While this strategy has delivered high returns, it’s crucial for investors to carefully assess the associated risks and conduct thorough research before allocating resources.
Buy stocks now with eToro – trusted and advanced investment platform
Disclaimer: The content on this site should not be considered investment advice. Investing is speculative. When investing, your capital is at risk.