Nvidia (NASDAQ: NVDA) has faced notable challenges in September as the equities market experiences turbulence amid widespread economic uncertainty.
Notably, the semiconductor giant has recorded one of its worst weeks in recent history, plunging over 9% and struggling to maintain its valuation above the $100 support zone. By the close of markets on September 6, NVDA was valued at $102, having dropped over 4% on the day.
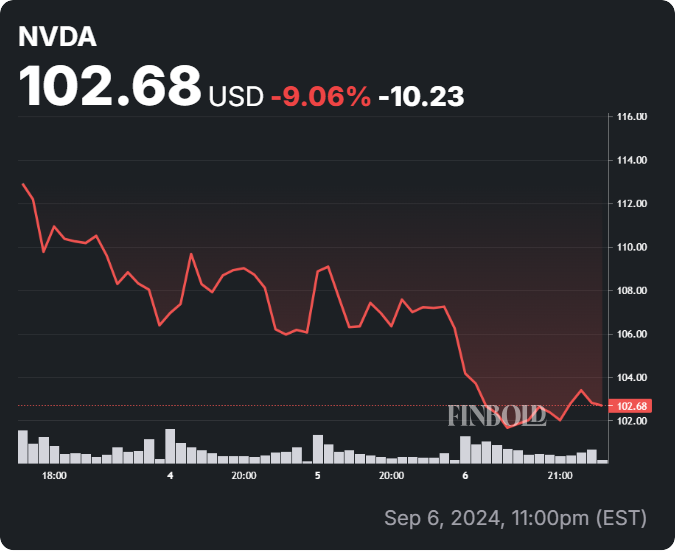
Overall, the stock has seen a notable decline since June, when it reached a market capitalization of $3.3 trillion and briefly became the world’s most valuable company.
Amid the ongoing market sell-off, a stock market expert highlighted that technical indicators suggest a potential downside for NVDA in the coming weeks. In a post on X on September 8, CyclesFan’s analysis observed that Nvidia had closed below the 20-week moving average for the second time in recent weeks.
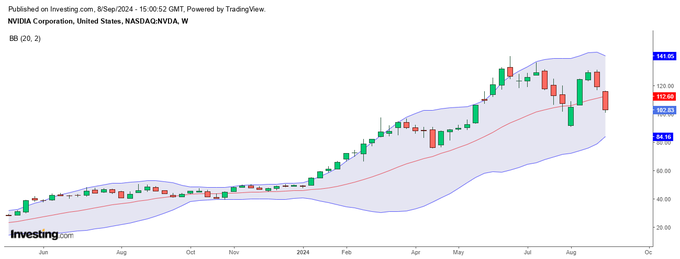
The expert pointed out that recent chart movements suggest the equity could retest the lower Bollinger Band (BB), last seen in October 2023.
It’s worth noting that Bollinger Bands are typically used to measure price volatility, and a widening band trend often indicates increased volatility. Nvidia, meanwhile, is attempting to find stability.
NVDA’s price levels to watch
A close below the 20-week moving average is commonly seen as a bearish signal, suggesting further downside is in the officing. The analyst projected that the stock could retest the lower BB between $84 and $102.
According to the expert, the lower Bollinger Band is expected to rise above its August low by late September, indicating that NVDA may not undercut this level even if it touches the lower band again. If the stock breaks down to this level, it could enter “oversold” territory, often seen as a potential buying opportunity.
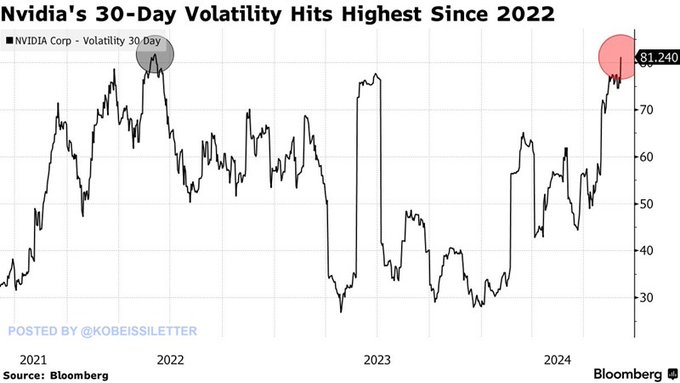
At the same time, data from The Kobeissi Letter also highlighted the negative outlook for Nvidia, stressing that, based on recent price movements, NVDA was trading like a penny stock.
For instance, Nvidia’s 30-day volatility hit its highest level since 2022 after surging 43% in the first three weeks of August and dropping nearly 20% the following week. Since its June peak, the company has wiped out $650 billion in market cap, with six swings of 15% recorded in the last three months.
Notably, Nvidia has been weighed down by investor concerns tied to the economic outlook following a mixed U.S. jobs report that heightened expectations of a potential Federal Reserve interest rate cut. Additionally, reports emerged of U.S. authorities investigating Nvidia for possible antitrust violations, further impacting the stock’s performance.
Wall Street analysts take on Nvidia
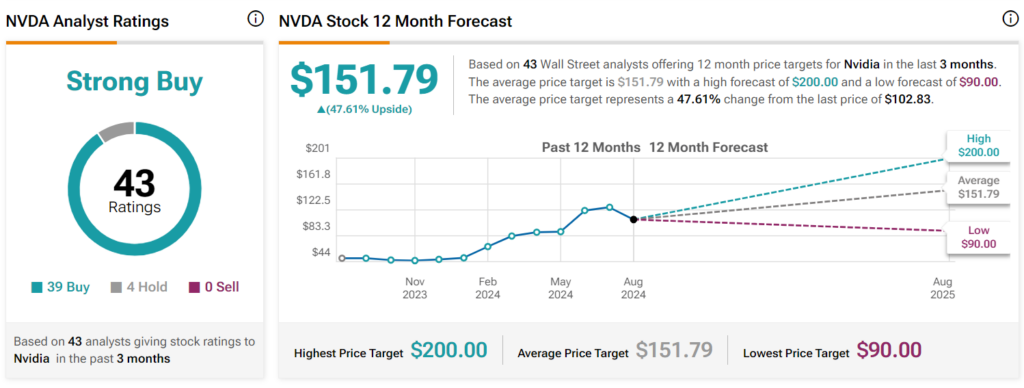
Meanwhile, an analysis by 43 Wall Street analysts at TipRanks projects that the stock could see a 47% upside over the next 12 months, potentially trading at $151. The analysts provided a high target of $200 and a low of $90.
In summary, while Nvidia has rallied mainly due to the AI boom, this catalyst may not be enough to drive a recovery in the short term. NVDA will rely heavily on overall market sentiment for a rebound while trying to avoid further declines below $100.
Buy stocks now with eToro – trusted and advanced investment platform
Disclaimer: The content on this site should not be considered investment advice. Investing is speculative. When investing, your capital is at risk.