The Standard & Poor’s 500 (S&P 500) benchmark index, almost universally used as a shorthand for the stock market, saw a roughly 25% move to the upside in 2024.
By the close of 2024, most Wall Street analysts were optimistic regarding 2025. They did not, however, expect to see another banner year. The Street high estimate, set by Oppenheimer’s John Stoltzfus, implied a 17.54% increase on the back of artificial intelligence (AI) advancements.
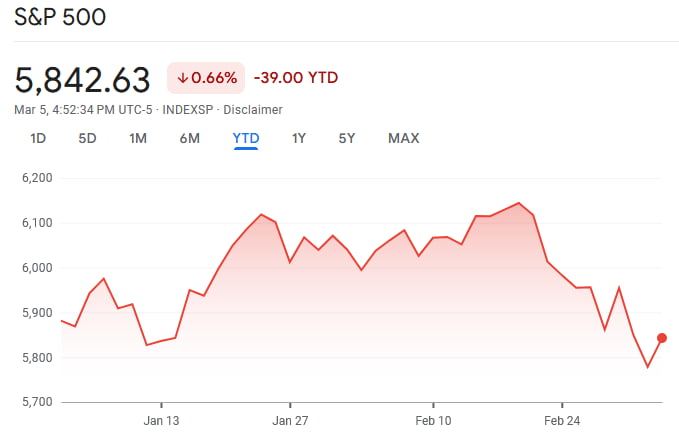
Thus far, it doesn’t seem likely that those forecasts will materialize. By press time on March 6, the index stood at 5,842 — having marked a 39 point decrease since the start of the year. In percentage terms, this is a 0.66% loss.
Numerous factors are at play. Chief among them is the budding trade war between the United States and the rest of the world.
Beyond potentially upending several G20 economies, causing resurgent inflation of the dollar, the global reserve currency, and numerous other negative consequences, the economic dispute has had an outsized effect on the stock market, which was at a historic high in terms of overvaluation even before the tariff exchange began.
Despite these still-developing worries, one technical analyst remains bullish — at least for the foreseeable future.
Can the S&P 500 hit 6,900?
Noted chart researcher TradingShot shared his analysis in a March 5 TradingView post. Per the analyst, the S&P 500 has been in a channel up pattern since the October 2022 market bottom.
A channel up, on its own, is a bullish pattern, but entails significant volatility. The current dip represents a higher low on the long-term chart — a sign that the prevailing bullish trend is still in play. Moreover, the S&P 500 has hit its 200-period moving average (MA) on the daily time frame for the first time since November 2023.
In addition, the relative strength index (RSI) has almost reached 30 — indicating near-oversold conditions. Over the past five years, such instances have presented the most optimal buying signals, as they were followed by significant, double-digit moves to the upside.
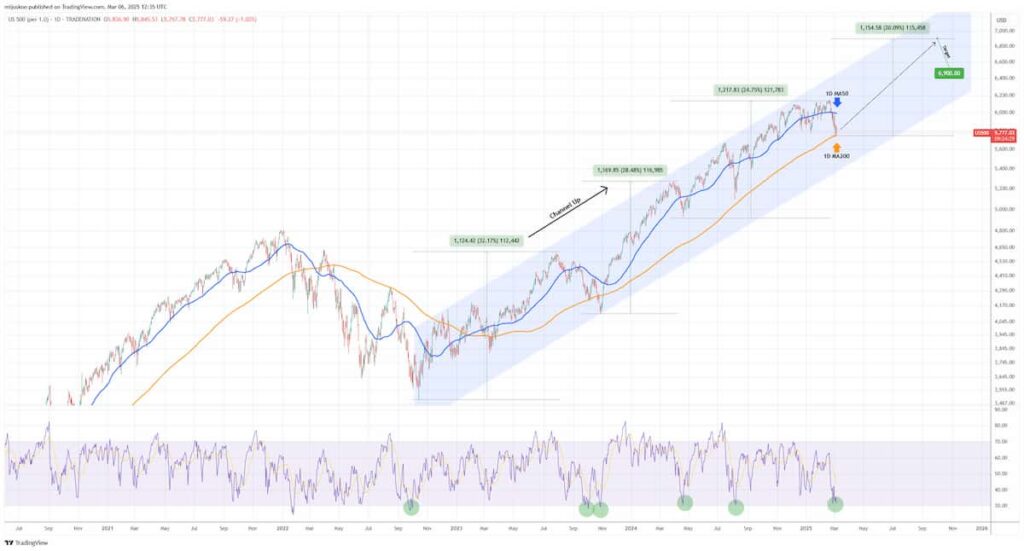
There’s another interesting occurrence that the analyst noted. In those five instances, each subsequent rally was 4% weaker. Accordingly, if the pattern holds and another surge occurs, this time around, the S&P 500 could see a 20% move to the upside. This would entail a rise to 6,900 — surpassing TradingShot’s previous estimates, which foresaw that the index would climb to 6,300 and 6,600.
Featured image via Shutterstock