Although Nvidia’s (NASDAQ: NVDA) stock price has been among the best-performing in recent months, the equity has been plagued by significant insider trading activities, potentially signaling uncertainty.
Indeed, data shared by Global Markets Investor in an X post on July 23 indicated that insider trading activity involving Nvidia executives has skyrocketed over the past three months.
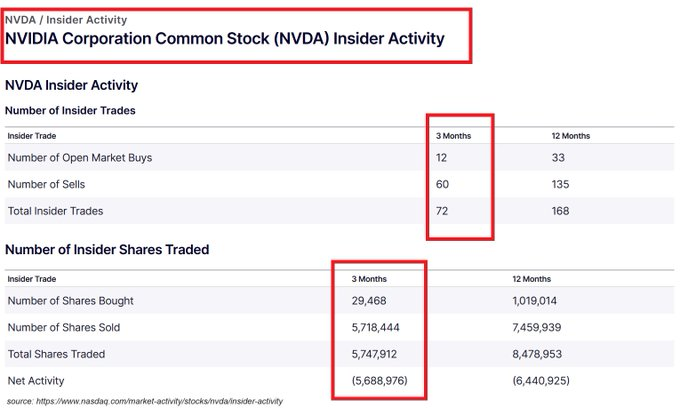
Specifically, during this period, there have been 72 insider trades, including 60 sales and 12 open market buys. Insiders sold a staggering 5.7 million shares, representing 77% of the total 7.46 million shares sold over the last 12 months.
Nvidia executives were responsible for 30 of these sales, accounting for 44% of all sales over the past year.
Implication of Nvidia insider trading activity
This spike in selling activity raises eyebrows, suggesting a potential lack of confidence among Nvidia’s executives in the company’s short-term stock performance. While insider selling can occur for various reasons, such as personal financial planning, the sheer volume and concentration of these recent transactions are notable.
For Nvidia, the sales align with the Rule 10b5-1 trading plan, which the company adopted on March 14, 2024. This initiative enables insiders to sell a predetermined number of shares at a predetermined time, providing a legal cushion against potential accusations of insider trading.
Notably, some executives involved in offloading the equity include CEO Jen-Hsun Huang, whose recent sales included 700,000 shares.
This trading activity might cast a focus on how Nvidia stock might trade in the near term, especially after recent days of battling bearish sentiments, some stemming from heightened geopolitical tensions.
Nvidia stock price analysis
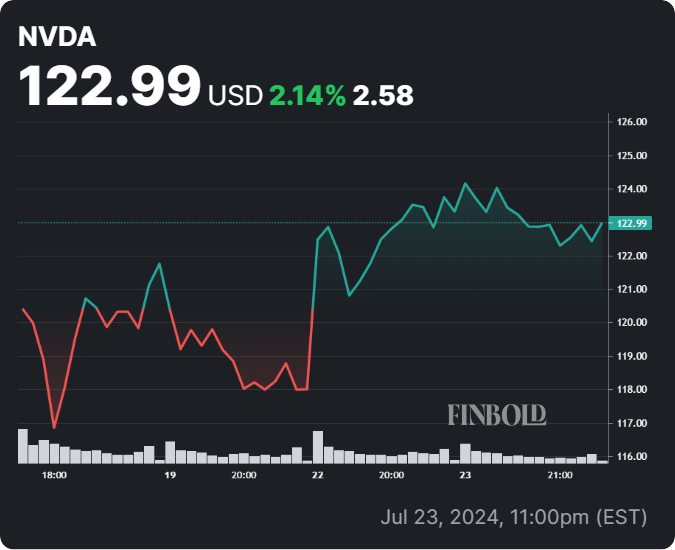
By the close of markets on July 23, Nvidia stock had reclaimed the $120 resistance zone, trading at $122.99, down less than 1% in 24 hours. On the weekly chart, the semiconductor giant is up slightly over 2%.
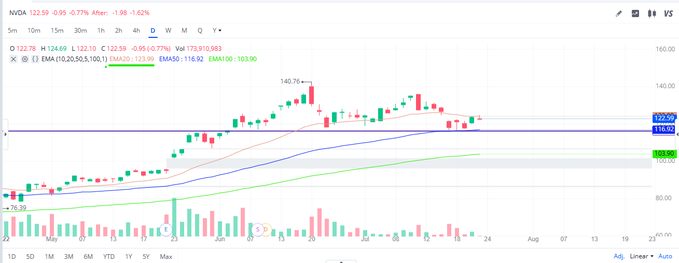
Ahead of the market opening on July 24, a stock trading expert who goes by the pseudonym Vnkumar Trades outlined key levels to watch for NVDA shares in an X post. The analyst noted that investors should watch for resistance at $124 and support levels at $120.5 and $116.
In the meantime, attention is also on the upcoming earnings report, with some analysts opining that the equity might rally if Nvidia records positive results.
Disclaimer: The content on this site should not be considered investment advice. Investing is speculative. When investing, your capital is at risk.