As Nvidia (NASDAQ: NVDA) investors anticipate the upcoming earnings report scheduled for August 28, the stock’s technical indicators have highlighted key price levels to monitor in the short term.
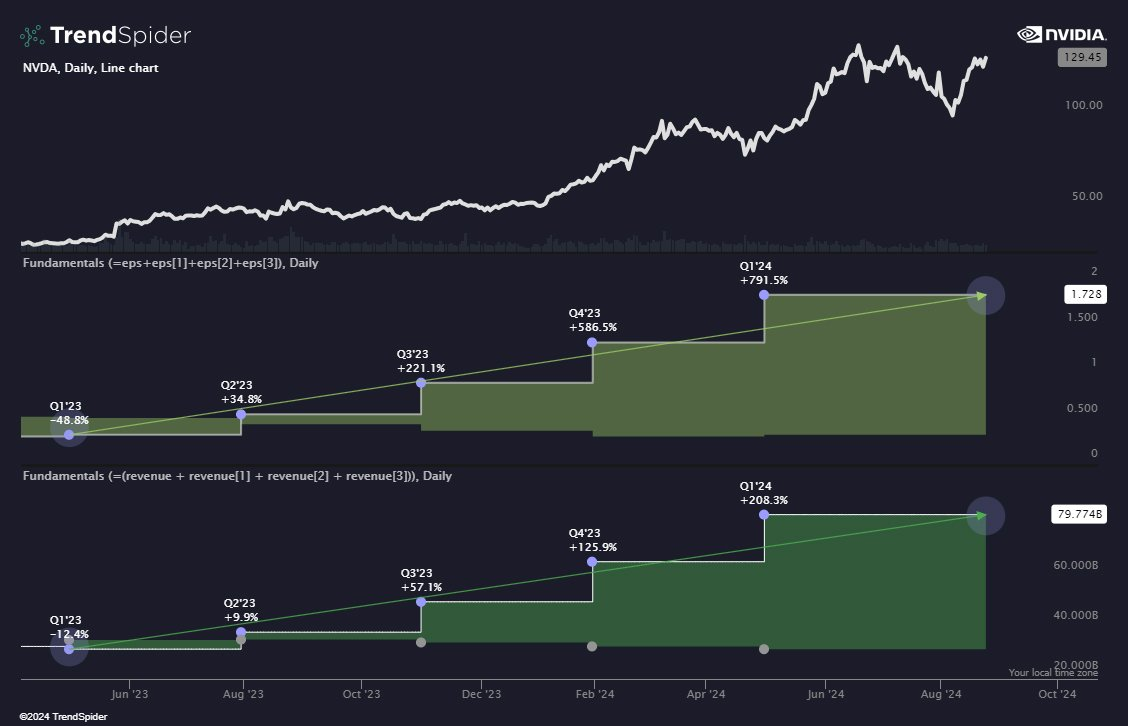
Nvidia ended the last trading session valued at $129, reflecting a 24-hour gain of nearly 5%. On the weekly chart, NVDA is up 4%.
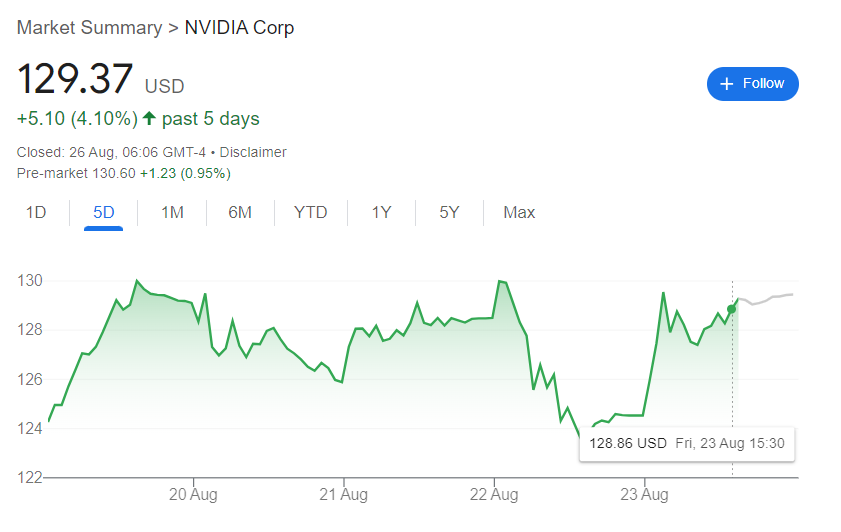
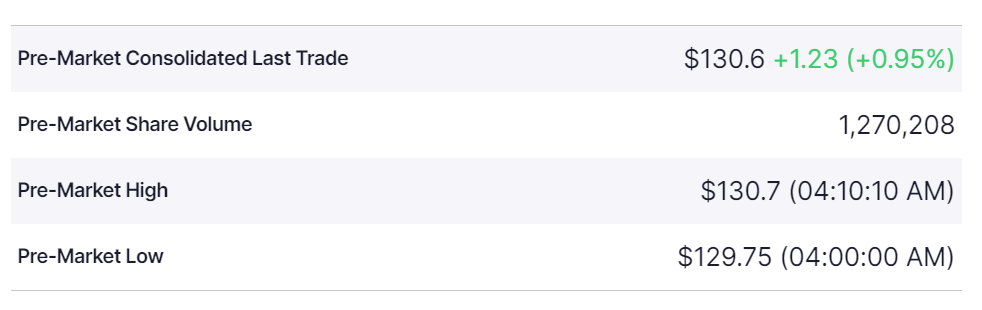
Nvidia was up almost 1% in premarket trading on August 26, reaching $130 after ending the previous session at $129.
Nvidia’s key technical indicators
Notably, an analysis shared by an analyst called CyclesFan in an X post on August 25 indicated that NVDA might have reached a critical inflection point, with technical indicators suggesting a potential bullish reversal.
According to the analysis, Nvidia likely made an intermediate-term low two weeks ago. Confirmation of this low hinges on a bullish crossover on the True Strength Indicator (TSI), a momentum oscillator traders often use to gauge the strength and direction of a trend.
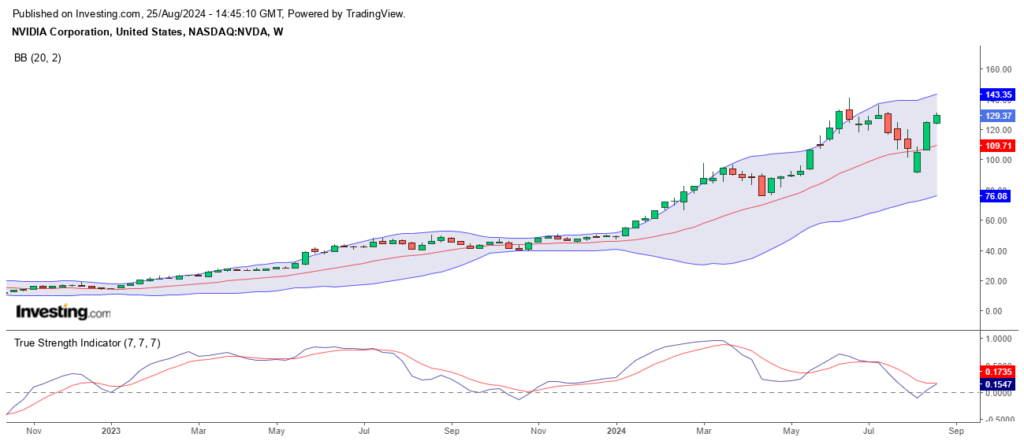
One of the most notable observations is the presence of a hidden bullish divergence in Nvidia’s TSI. This divergence occurs when the indicator shows a lower high while the price chart shows a higher low. In Nvidia’s case, the TSI exhibited an overall decline from March into August.
“Notice that the TSI had an overall decline from March into August while the August low was higher than the April low, AKA hidden bullish divergence,” the expert noted.
However, the stock’s low in August was higher than its low in April, indicating potential underlying strength that may not be immediately visible on the price chart.
This hidden bullish divergence suggests that while Nvidia’s momentum was declining, the price was still holding up relatively well—a scenario often preceding a trend reversal. If the TSI crosses to the upside, it could signal the start of a new upward trend, potentially driving Nvidia’s stock price higher in the coming weeks.
In the meantime, analysts at Bank of America have expressed confidence in the equity, labeling Nvidia stock a “table-pounding buy.”
NVDA’s key price levels to watch
Regarding price movement, the NVDA trades within the Bollinger Bands (BB), with the upper band around $143.55 and the lower band at $76.68. Nvidia’s recent bounce off the lower band indicates that $100 could be a critical support level.
On the upside, breaking above the $120 resistance level could confirm the bullish scenario, with the potential for Nvidia to retest its previous highs near $150.
It’s worth noting that the semiconductor giant has recently attempted to find stability after experiencing significant volatility in early August. Ahead of the earnings report, investors estimate that the company will likely witness further upside, especially with expectations that the tech firm will meet targets.
In line with this, analysts are forecasting a robust performance. The company’s EPS (Earnings Per Share) is projected to be $0.64, marking a significant 138% year-over-year increase. Revenue is also expected to impress, with estimates of $28.71 billion, reflecting a 113% growth compared to last year’s quarter.
Most importantly, attention will be paid to whether Nvidia can demonstrate how its clients for artificial intelligence (AI) chips are generating revenue. Some analysts suggest that if the chipmaker records positive earnings, NVDA will likely hit $150.
Disclaimer: The content on this site should not be considered investment advice. Investing is speculative. When investing, your capital is at risk.