In stock trading, market participants use two contrasting types of analysis. Fundamental analysis examines market news, economic/social/political forces, and earnings data to predict how an asset’s price will move. Technical analysis, on the other hand, uses charts and various technical indicators to forecast market conditions. One of the essential tools used for technical analysis in securities trading is the stochastic oscillator. Its primary incentive is to understand how strong the market’s momentum is.
The following guide will examine the indicator, what it is and what it measures, how to understand it on charts and interpret those findings, how to use stochastic oscillator, as well as the pros and cons of using this technical analysis tool.
Best Crypto Exchange for Intermediate Traders and Investors
-
Invest in cryptocurrencies and 3,000+ other assets including stocks and precious metals.
-
0% commission on stocks - buy in bulk or just a fraction from as little as $10. Other fees apply. For more information, visit etoro.com/trading/fees.
-
Copy top-performing traders in real time, automatically.
-
eToro USA is registered with FINRA for securities trading.
What is the stochastic oscillator?
Stochastic oscillator definition
This technical analysis indicator measures momentum: the rate of acceleration in price movement. The theory behind the stochastic oscillator is that the momentum of an asset’s price will often change before the asset’s price movement changes direction. Subsequently, the stochastic oscillator can be used to predict trend reversals.
Typically, the stochastic indicator is employed by experienced traders and those learning technical analysis. The stochastic oscillator can improve trading accuracy and identify lucrative entry and exit points, particularly with the support of other technical analysis tools such as trendlines, moving averages, and support and resistance levels.
Read also:
What is Value Investing?
What is Momentum Investing?
How to Buy and Sell Stocks?
Dividend Investing for Beginners
10 Best Stock Trading Books for Beginners
15 Top-Rated Investment Books of All Time
Stochastic oscillator indicator formula
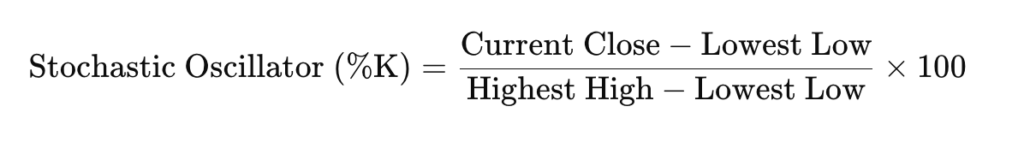
Where:
- Current close is the most recent closing price;
- Lowest low is the lowest price over the look-back period;
- Highest high is the highest price over the look-back period.
History of the stochastic oscillator
George Lane developed the stochastic oscillator in the late 1950s to use in the technical analysis of securities. Lane was a financial analyst and one of the first researchers to publish research papers on the use of stochastics. According to an interview with Lane, the stochastic oscillator:
“Doesn’t follow price, it doesn’t follow volume or anything like that. It follows the speed or the momentum of price. As a rule, the momentum changes direction before price.”
In this way, the stochastic oscillator can also be used to predict market reversal turning points when the indicator reveals bullish or bearish divergences and can be seen as arguably the most crucial trading signal Lane identified.
Recommended video: Barry Norman’s educational class on the Stochastics Oscillator
How does the stochastic oscillator work?
Rather than measuring price or volume, the stochastic oscillator compares the most recent closing price to the high-low range of the price across a fixed amount of past periods. Generally, it uses 14 previous periods. The indicator’s goal is to predict price reversal points by comparing the closing price to previous price movements.
This two-line indicator can be entered into any chart and fluctuates between 0 and 100. The indicator demonstrates how the current price compares to the highest and lowest price levels over a predetermined past period. For example, as the period typically consists of 14 individual periods, this will be 14 weeks on a weekly chart. On an hourly chart, accordingly, 14 hours.
Stochastic oscillator charting typically consists of two lines. A white line, known as the %K line, will appear below the chart when the stochastic indicator is applied and reflects the actual value of the oscillator. And a red – referred to as %D – is the three-period moving average of %K. Since price is thought to follow momentum, the conjunction of these two lines can signal that a reversal may be on the way.
How to read the stochastic oscillator?
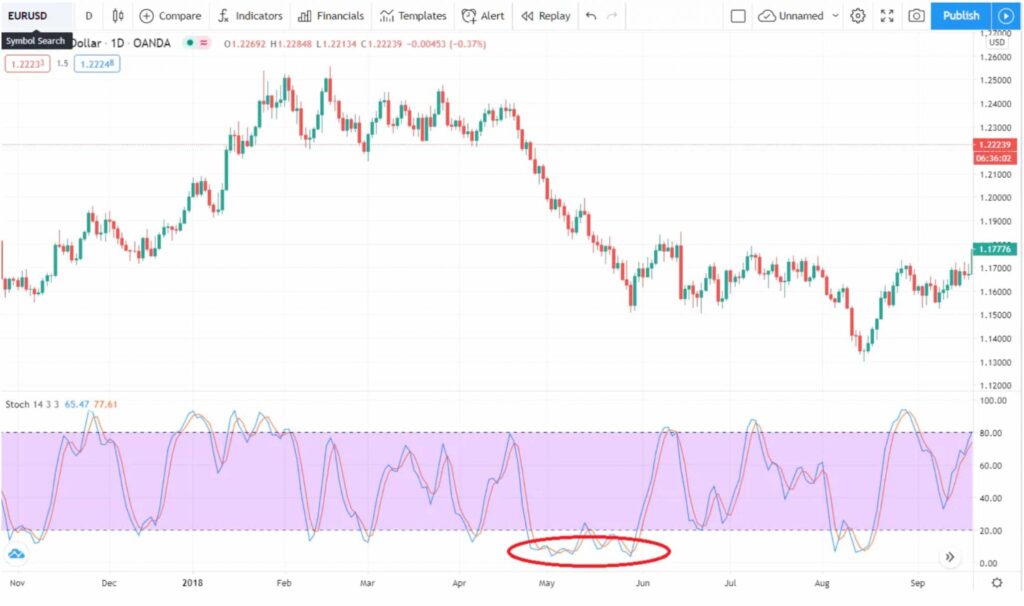
To read stochastic oscillators, you first need to know that the stochastic indicator is range-bound, always scaled between 0 and 100, making it a valuable indicator of overbought and oversold conditions.
Readings above 80 signal that the asset is trading near the top of its high-low range. Conversely, readings below 20 indicate that the asset is trading near the bottom of its high-low range. Readings above 50 suggest the asset is trading among the upper section of the trading range. Readings below 50 signal that the asset is trading in the lower part of the trading range.
Traditionally, readings above 80 indicate that the instrument is in the overbought range, and readings under 20 suggest oversold conditions. Oversold and overbought levels can be used to forecast trend reversals.
The price is moving lower if the stochastic indicator falls from above 80 to below 50. The price is moving higher if the indicator shifts from below 20 to above 50.
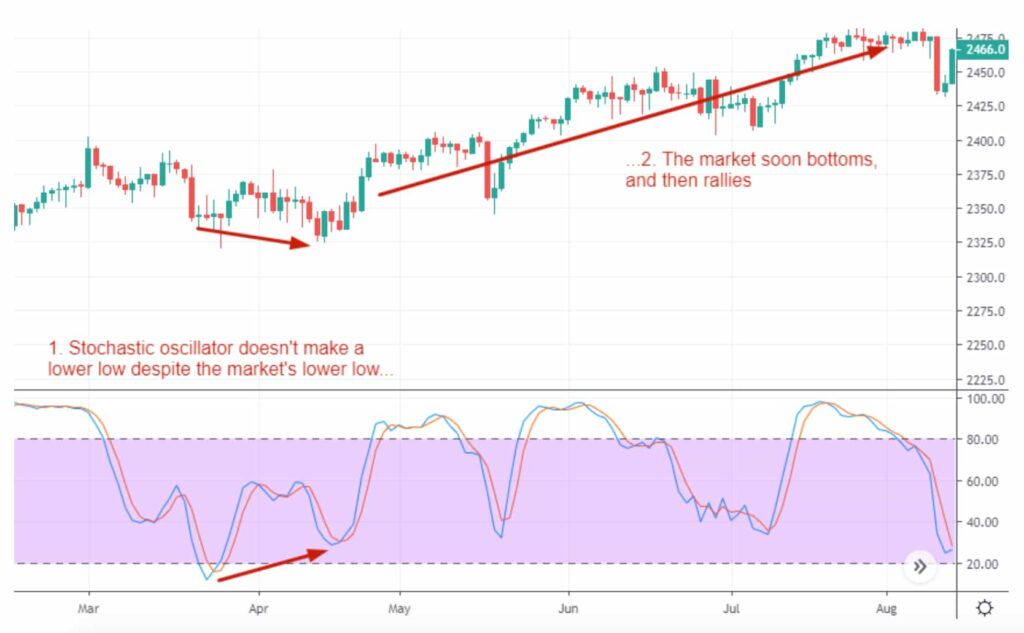
Traders look for divergence – stochastic oscillator and trending price move away from each other – indicating that a price trend is waning and may soon reverse. For instance, when a bearish trend reaches a new lower low but the oscillator prints a higher low, it may indicate that the bear market is exhausting its momentum, and a bull market reversal is looming ahead.
Stochastic Oscillator calculation example
To calculate the stochastic oscillator, you subtract the low for the period from the up-to-date closing price. Then, you divide the total range for the period and multiply by 100. Keep in mind the standard period is 14 days.
Stochastic oscillator calculation example
The stochastic oscillator indicates the stability with which the price closes near its recent high or low by comparing the current price to the range over time. A reading of 80 indicates that the instrument is on the brink of being overbought.
Stochastic oscillator vs. stochastic momentum index (SMI)
Both are stochastic tools that are used to determine momentum in any given market condition. The stochastic oscillator is a more basic technical analysis tool and shows directional momentum based on the asset’s closing price.
However, the stochastic momentum index (SMI) shows the closing momentum relative to the median high or low range for a particular time period.
Stochastic oscillator vs. the relative strength index (RSI)
The stochastic oscillator and the relative strength index (RSI) are both price momentum tools used to predict market trends. While often used in tandem, there are notable differences between the two indicators.
The stochastic oscillator is built on the assumption that closing prices should confirm the current trend’s direction. However, the RSI tracks overbought and oversold levels by measuring the momentum of price movements. In other words, the RSI was designed to measure the speed of price movements, while the stochastic oscillator formula works best in consistent trading ranges.
The RSI is generally more useful for trending markets and stochastic oscillators in sideways or choppy markets.
Best Crypto Exchange for Intermediate Traders and Investors
-
Invest in cryptocurrencies and 3,000+ other assets including stocks and precious metals.
-
0% commission on stocks - buy in bulk or just a fraction from as little as $10. Other fees apply. For more information, visit etoro.com/trading/fees.
-
Copy top-performing traders in real time, automatically.
-
eToro USA is registered with FINRA for securities trading.
How to use the stochastic oscillator: Trading strategies
The following strategies are the primary uses of the stochastic oscillator:
#1 Identifying overbought and oversold conditions
The stochastic indicator helps traders identify trade exit and entry points by applying the overbought/oversold strategy. A stochastic reading is above 80 indicates an overbought level. Readings below 20 signify oversold conditions in the market.
Typically, traders look to place a buy trade when an instrument is oversold. A sell signal is provoked once the oscillator reading goes above 80 and returns to readings below 80. In contrast, a buy signal is initiated when the oscillator shifts below 20 and then back above 20.
However, overbought and oversold labels can be misleading. An instrument won’t necessarily fall in price just because it is overbought. Similarly, it won’t automatically rise because it is oversold. Overbought and oversold merely mean the price is trading near the top or bottom of the range for the specified time period.
#2 Divergence strategy
Another favored trading strategy using the stochastic indicator is the divergence strategy, in which traders will look to see if a security’s price is making new highs or lows that are not reflected on the stochastic oscillator. This is seen as a signal that the trend is about to reverse.
A bullish divergence occurs when an asset’s price makes a new low, but the oscillator does not correspondingly move to a further low reading. This signals that selling pressure has decreased, and a reversal upwards could be about to emerge.
Similarly, a bearish divergence occurs when an asset’s price moves to a new high, but the oscillator does not correspondingly move to a further high reading.
This signals that upward momentum has slowed, and a reversal downward may take hold. The failure of the oscillator to gain a new high alongside the instrument’s price action doing so signals that the momentum of the uptrend is beginning to weaken.
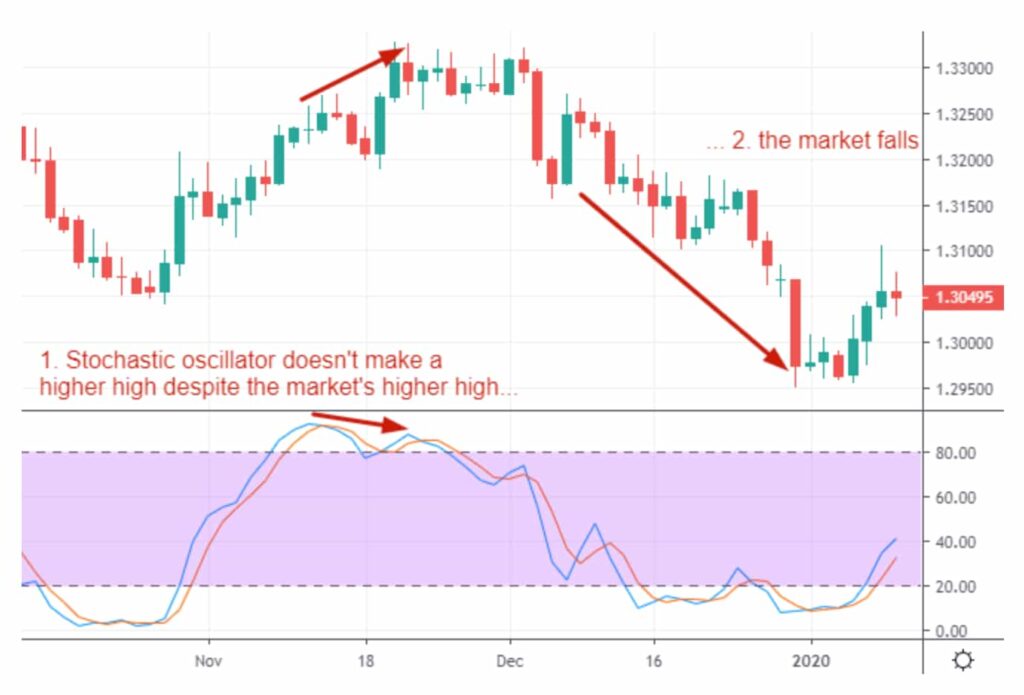
An important point concerning the divergence strategy is that trades should not be made until an actual turnaround in the price confirms divergence. This is because the stochastic oscillator may give a divergence signal some time before the instrument’s price actually changes direction.
For example, when the oscillator indicates bearish divergence, the price may still continue climbing higher for several trading sessions before turning to the downside.
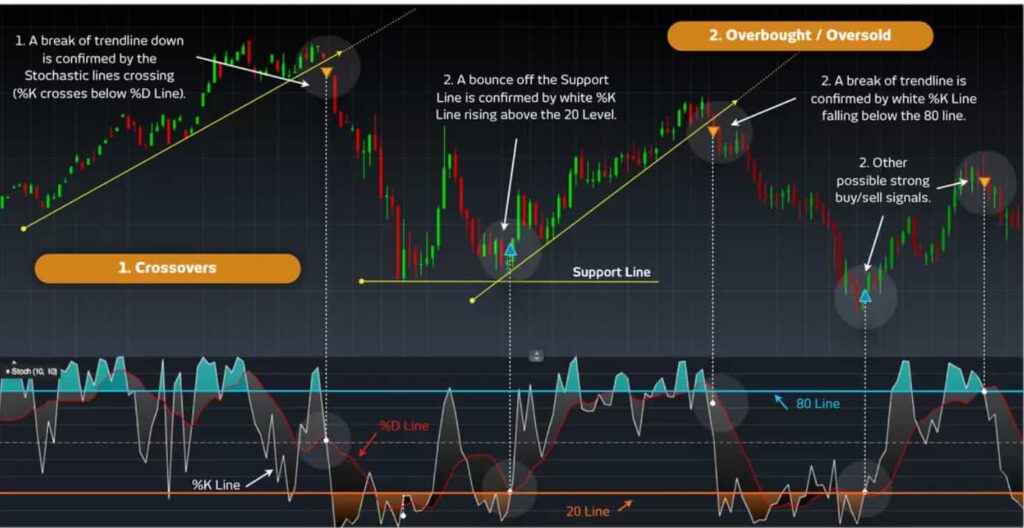
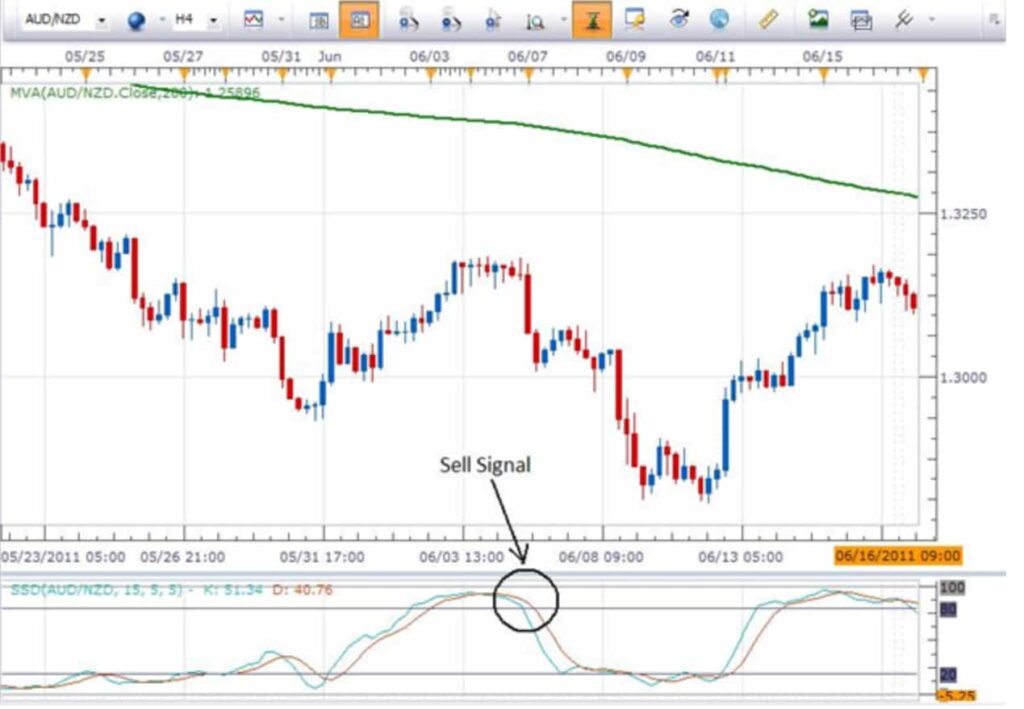
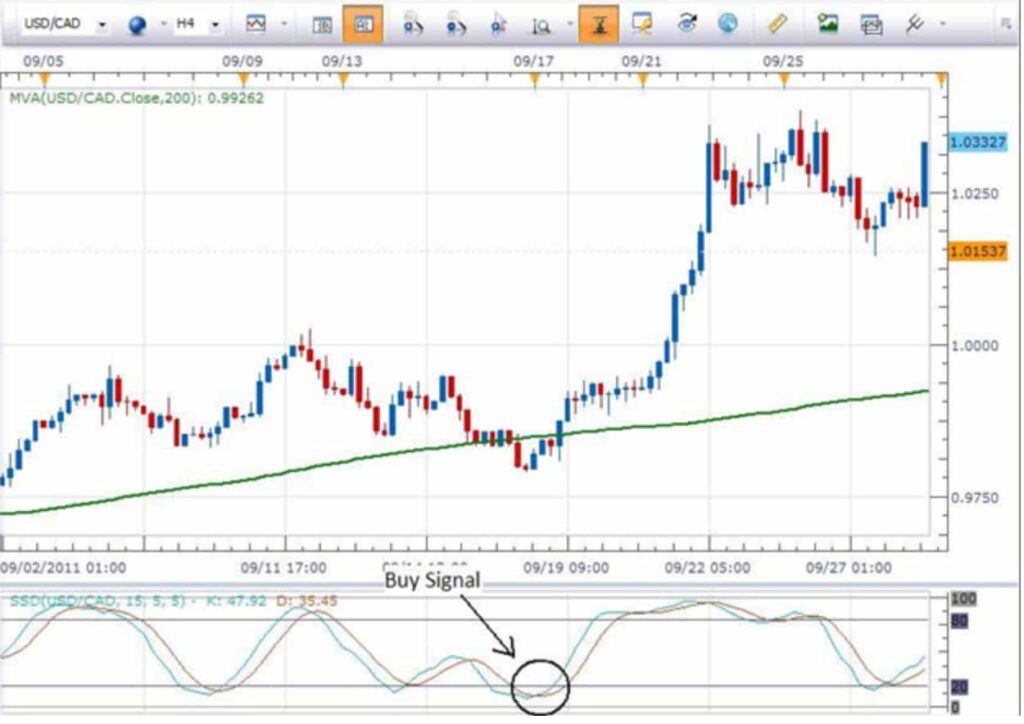
#3 Crossovers
Another popular trading strategy is the stochastic crossover, which occurs when the fast and slow stochastic lines intersect.
The fast stochastic line is the 0%K line, and the slow stochastic line is the %D line. A bullish scenario is when the %K line intersects the %D line and goes above it. Conversely, the %K line crossing from above to below the %D stochastic line gives a bearish sell signal.
These signals tend to be more reliable in a range-bound market. However, they are less reliable in a trending market.
In a trend-following strategy, traders monitor the stochastic indicator to ensure it stays crossed in one direction. This shows that the trend is still valid.
Stochastics in a downtrend, sell signal occurs when the two moving averages have been above 80 and then move below 80:
Stochastics in an uptrend, buy signal occurs when the two moving averages have been below 20 and then move above 20:
#4 Bull/bear set-ups
Lastly, another widespread use of the stochastic indicator is identifying bull and bear trade setups.
A bull trade setup happens when the stochastic indicator makes a higher high. Yet, the instrument’s price makes a lower high, signaling that momentum is growing and the price could move even higher. In this case, traders often look to buy after a brief price pullback in which the stochastic indicator has dropped below 50, continuing to move higher again.
A bear trade setup ensues when the stochastic indicator makes a lower low. Yet, the instrument’s price makes a higher low, indicating that selling pressure is mounting as the security’s price may fall even more. As a result, traders often look to place a sell trade after a brief rebound in the price.
Pros and cons of the stochastic oscillator
As with most other technical analysis tools, the stochastic oscillator, too, comes with its own set of unique advantages and disadvantages. Therefore, it’s essential to understand where this momentum indicator excels and where it fails to get the most out of its use.

Pros
- The stochastic oscillator provides straightforward entry and exit indicators;
- Depending on the selected time setting, the stochastic oscillator offers frequent signals, which is particularly beneficial for day traders;
- The strategy of identifying crossovers in overbought or oversold areas has the advantage of helping traders jump into trades earlier so they can ride the move from its earliest point and get maximum gains;
- The indicator is theoretically reasonably simple to understand and is available on most charting packages.

Cons
- The main drawback of the oscillator is its inclination to generate false signals. They are especially prevalent during turbulent, highly volatile trading conditions, which is why it’s crucial to confirm stochastic trading signals with other technical analysis indicators;
- Essential to keep in mind that the oscillator is primarily designed to measure the strength or weakness of price movement in a market, and not its the trend or direction;
- Because the price can stay in the overbought or oversold area for a long time, crossovers are useless until the indicator breaks and moves past the 80 or 20; making it difficult to accurately time entries and exits.
Adjusting oscillator readings to reduce false signals
One way to curb false signals is to use more extreme oscillator readings to indicate overbought/oversold conditions in a market. For example, rather than using readings above 80 as the distinction line, they only interpret readings above 85 to signal overbought conditions.
On the bearish side, only readings of 15 and below are interpreted as indicated oversold conditions. While the adjustment to 85/15 does eliminate the number of false signals, it may lead to traders missing lucrative opportunities. For instance, suppose during an uptrend, the oscillator reaches a high reading of 82, after which price turns to the downside. In that case, a trader may have missed the opportunity to sell at an ideal price point because the oscillator never reached its required overbought indication level of 85 or above.
In conclusion
To sum up, as one of the most popular widely-used technical indicators on the market, the stochastic indicator is mainly used to identify overbought and oversold levels. Moreover, when combined with other indicators, the stochastic oscillator can help a trader identify possible trend reversals and potential entry and exit points.
However, the momentum indicator is prone to generating false signals. Therefore, it is best used along with other technical signifiers rather than as a standalone source of trading indicators.
Disclaimer: The content on this site should not be considered investment advice. Investing is speculative. When investing, your capital is at risk.
FAQs about the stochastic oscillator
What is the stochastic oscillator?
The stochastic oscillator is a popular technical analysis tool that indicates momentum by comparing a particular security’s closing price to a range of prices over a specific period, utilizing a 0–100 bounded range of values.
What is the stochastic oscillator used for?
The stochastic oscillator is a valuable indicator for overbought and oversold conditions. Typically, readings above 80 indicate that the instrument is in the overbought range, and readings under 20 suggest oversold conditions. Furthermore, oversold and overbought levels can be used to forecast trend reversals.
What is divergence in stochastics?
A divergence occurs when the stochastic oscillator and trending price move away from each other – indicating that a price trend is waning and may soon reverse. A bullish divergence occurs when an asset’s price makes a new low, but the oscillator does not correspondingly move to a further low reading. A bearish divergence occurs when an asset’s price moves to a new high, but the oscillator does not correspondingly move to a new high reading.
What are the limitations of stochastic oscillator?
The main drawback of the oscillator is its inclination to generate false signals. This is when the indicator generates a trading signal, yet the price does not follow through, resulting in a losing trade. They are especially prevalent during turbulent, highly volatile trading conditions, which is why it’s crucial to confirm stochastic trading signals with other technical analysis indicators
What are the best stochastic oscillator settings?
The best stochastic oscillator settings depend on your trading style and the market conditions, but common settings are %K Period: 14, %D Period: 3, and Smoothing: 3 (stochastic oscillator 14, 3, 3). Shorter settings make it more sensitive to short-term price movements, while longer settings offer smoother signals but are less responsive to rapid changes.
What does a stochastic oscillator tell you?
The stochastic oscillator tells you the position of a current closing price relative to its price range over a specific period. It indicates whether an asset is overbought or oversold, helping traders identify potential trend reversals. High readings suggest the asset may be overbought, while low readings indicate it might be oversold.
What is d and k in stochastic?
In the stochastic oscillator, %K is the raw measure that indicates the current closing price’s position relative to the range over a specified period. %D is the moving average of %K, typically a 3-period simple moving average, which smooths out the %K values to generate a more stable signal. %D is often used to identify buy or sell signals when it crosses %K.
What is 5-3-3 stochastic settings?
The 5-3-3 stochastic settings refer to the configuration of the Stochastic Oscillator. The first “5” represents the number of periods used to calculate the %K line (the raw stochastic value). The first “3” indicates the number of periods used to calculate the moving average of %K, which is the %D line. The second “3” is the smoothing factor applied to the %K line, making the oscillator less sensitive to price fluctuations. These settings help traders identify overbought and oversold conditions more effectively.
Which indicator is better MACD or stochastic?
Whether the MACD (moving average convergence divergence) or stochastic oscillator is better depends on your trading strategy and market conditions. While MACD excels in identifying trend strength and direction, making it more effective in trending markets; the Stochastic Oscillator is better for spotting overbought or oversold conditions, making it useful in range-bound or choppy markets.
Is RSI or stochastic better?
Both RSI (relative strength index) and stochastic oscillator are useful momentum indicators, but which one is better depends on the trading strategy. RSI is generally better for identifying overbought or oversold conditions in trending markets, while stochastic is more effective in identifying these conditions in range-bound markets. Many traders use them together for a more comprehensive analysis.