
Traders in the stock market have a wide array of options regarding strategy, including long and short holdings, as well as customized approaches like the 8/21 Exponential Moving Average (EMA) strategy on Nvidia (NASDAQ: NVDA) shares.
For instance, over the past five years, employing this strategy with an entry on every bullish cross of the 8/21 EMA and an exit on the bearish cross would have resulted in an impressive 859% return, with a risk-to-reward ratio of 11.59 and a 14.06% return per position.
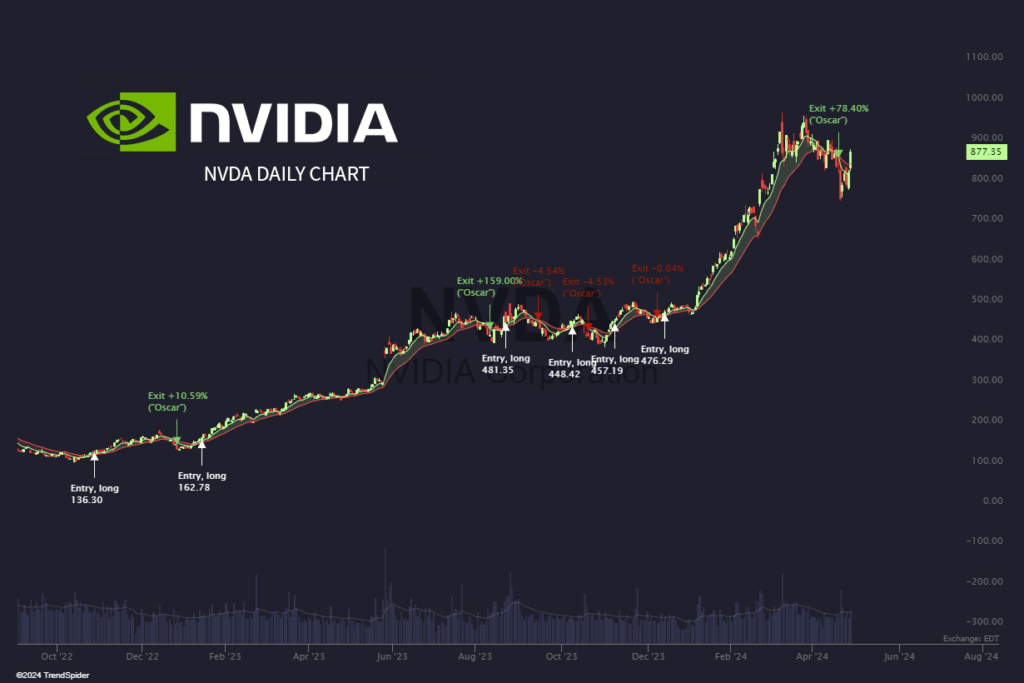
The good news is that a new entry point on the NVDA price chart is getting very close to opening with NVDA shares trading at $877.35 since April 26 close, with slight losses amounting to 0.26% in the pre-market putting the price at $875.10.
What is the 8/21 EMA trading strategy?
The 8,13, and 21 Exponential Moving Average strategy analyzes market trends using three Fibonacci number-based EMAs. These EMAs include the 8-day, 13-day, and 21-day EMAs, which provide insights into market movements and potential trade entry and exit points.
Unlike simple moving averages, EMAs prioritize recent price data, making them more responsive to current market conditions, especially in volatile markets. This responsiveness is particularly advantageous for short-term trading strategies.
In practice, this strategy generates buy and sell signals based on the positioning and crossing of these EMAs. Traders can make informed trade decisions by identifying trends and potential price reversals.
How to set up the 8/21 EMA strategy on the NVDA chart?
Many novice traders often fall into the trap of believing that complexity equates to effectiveness in trading strategies.
However, simplicity often yields better results. By adhering to a straightforward, rule-based entry approach, traders can avoid the pitfalls of overanalysis when interpreting charts.
This strategy identifies bullish signals when the 8-day Exponential Moving Average crosses above both the 13-day and 21-day EMAs.
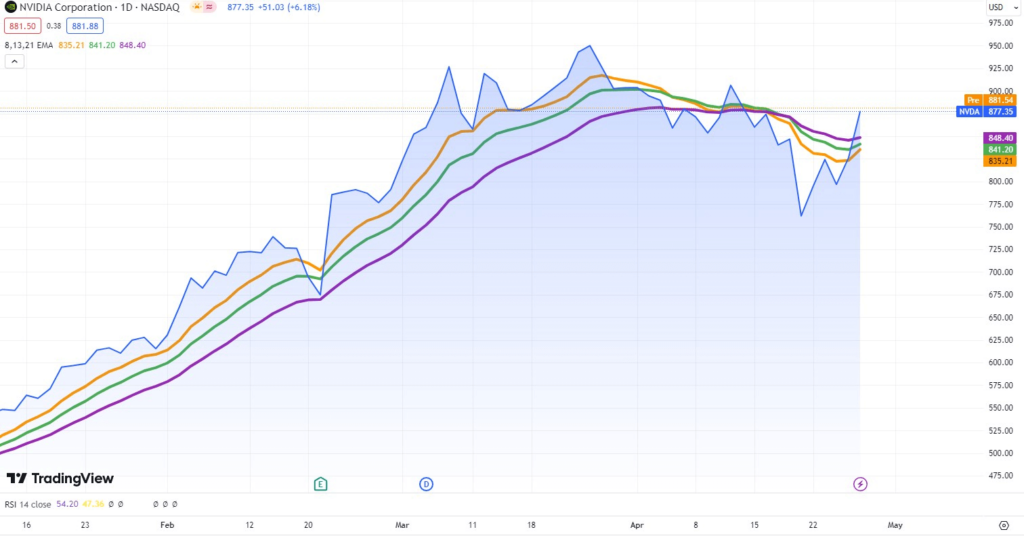
Conversely, bearish signals are indicated when the 8-day EMA crosses below the 13-day and 21-day EMAs, thus presenting an exit point.
Buy stocks now with eToro – trusted and advanced investment platform
Disclaimer: The content on this site should not be considered investment advice. Investing is speculative. When investing, your capital is at risk.