
The significant market correction has raised concerns among investors, prompting fears of a deeper market downturn. However, seasoned experts advise against panic.
A detailed analysis of Bitcoin’s (BTC) price movements reveals a compelling narrative for those who understand the opportunities within this volatility.
Historical data shows that such drawdowns are a part of bull markets. Bitcoin’s history is marked by numerous corrections integral to the market’s long-term growth trajectory.
Adam Back, founder and CEO of Blockstream, emphasizes the importance of zooming out to see the bigger picture during these market corrections. He highlights significant corrections in Bitcoin’s price over different periods, showing the extent of each correction from the previous high.
Despite these sharp declines, the overall trend of Bitcoin remains upward, indicating that these corrections are part of its long-term growth trajectory.
The 200-day moving average, a common indicator used to gauge the long-term trend, shows that Bitcoin often revisits or slightly dips below this line during corrections but eventually resumes its upward trend.
Historical context and strategic insights
The historical corrections are not isolated incidents but part of a larger trend of growth and resilience. Each dip provides a buying opportunity for investors and traders who understand the cyclical nature of Bitcoin’s price movements.
The current market is experiencing a drawdown of approximately -26%, which is relatively moderate compared to historical data. This suggests a potentially less severe correction phase in the current bull run.
While short-term volatility can be daunting, the long-term trajectory has consistently moved upward. Historical data further shows that buying during significant dips often leads to substantial returns.
Each correction has been followed by a rebound, often leading to new all-time highs. The 200-day moving average serves as a critical benchmark. Bitcoin’s tendency to recover after touching or slightly breaching this average highlights its enduring bullish trend.
Adding to the optimism, trader Rekt Capital comments that, compared to historical data—where the average retracement depth is 22%, and the average duration is 42 days—this current pullback appears typical in terms of depth but slightly prolonged in duration.
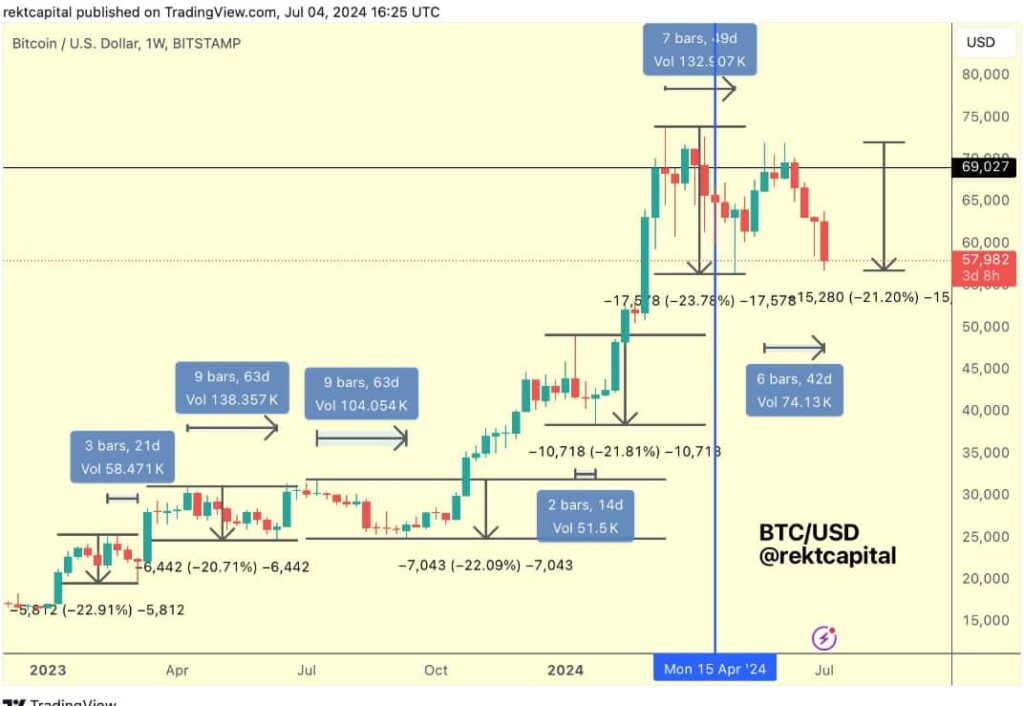
Notable previous pullbacks include a -22.91% retracement over 21 days with a volume of 58.471K, and a -21.20% retracement over 42 days with a volume of 74.13K. The volumes associated with these historical pullbacks indicate strong selling pressures during these periods.
Overall, while the depth of the current retracement aligns with typical market behavior, its duration of 45 days slightly exceeds the average, highlighting a marginally extended correction period.
This analysis underlines the typical nature of market corrections in the BTC/USD cycle, providing valuable insights for traders and investors to understand and anticipate potential future movements.
Current market analysis and strategic opportunities
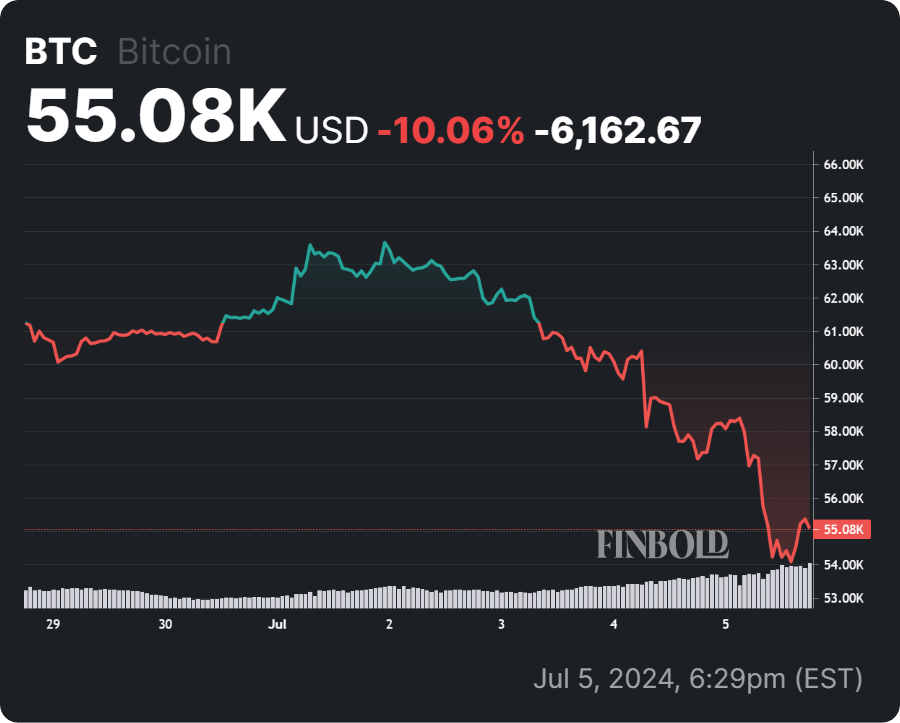
Currently, Bitcoin is trading at $55,309, down 4.62% at press time. On the 4-hour chart, immediate support is at $53,140, with further support at $51,720 and $49,910. The Relative Strength Index (RSI) is at 17, indicating extremely oversold conditions.
Historical trends suggest that these downturns are temporary and often followed by substantial recoveries. Understanding market cycles and recognizing that corrections are part of the market’s natural ebb and flow can help investors avoid making impulsive decisions.
Disclaimer: The content on this site should not be considered investment advice. Investing is speculative. When investing, your capital is at risk.