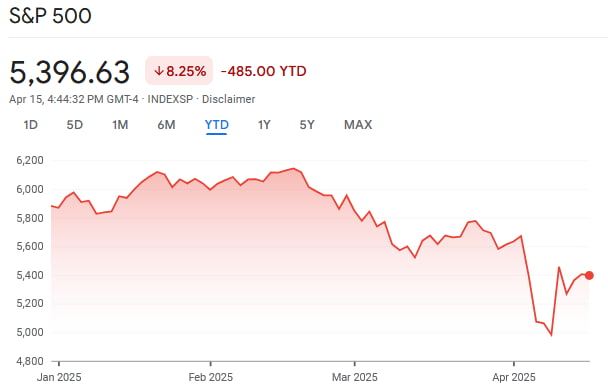
The S&P 500 has experienced a significant degree of volatility in April. The benchmark index reached an all-time high (ATH) of 6,129 on February 18. However, concerns regarding the macroeconomic impacts of the Trump administration’s trade war have severely diminished investor confidence.
A crucial development happened on April 2, when blanket tariffs against more than 60 countries were unveiled. In the immediate aftermath, the S&P 500 crashed from 5,670 to 4,982. This 12.13% drop wasn’t long-lived, however, on account of the recently announced tariff pause. By press time on April 16, the index stood at 5,396, a figure that still represents an 8.04% drop on a year-to-date (YTD) basis.
As optimistic as things might look at present, a bearish technical signal has recently appeared — a death cross. This chart pattern occurs when the 50-day moving average (MA) moves below the 200-day MA, and tends to precede sharp moves to the downside. The S&P 500 death cross occurred on Thursday, April 10 — but this time around, the signal might not be as foreboding as it usually is.
Why this S&P 500 death cross could mark the start of a stock market recovery
The appearance of this chart pattern was noted by renowned technical analyst TradingShot in an April 15 TradingView post. Although he noted that the last time this occurred was in the May 2022 inflation crisis correction, the chart expert likened current developments to a different downturn — the 2020 COVID crash.
Whereas the inflation correction was a technical bear cycle, the latest move to the downside was a flash crash — in the case of both COVID and tariffs, market-wide uncertainty led to a rapid selloff.
Like all chart patterns, the death cross is not 100% reliable. In fact, during the COVID crash, this pattern occurred just 4 days after the March 2020 bottom. Further losses did not ensue — instead, the S&P 500 started gaining ground.
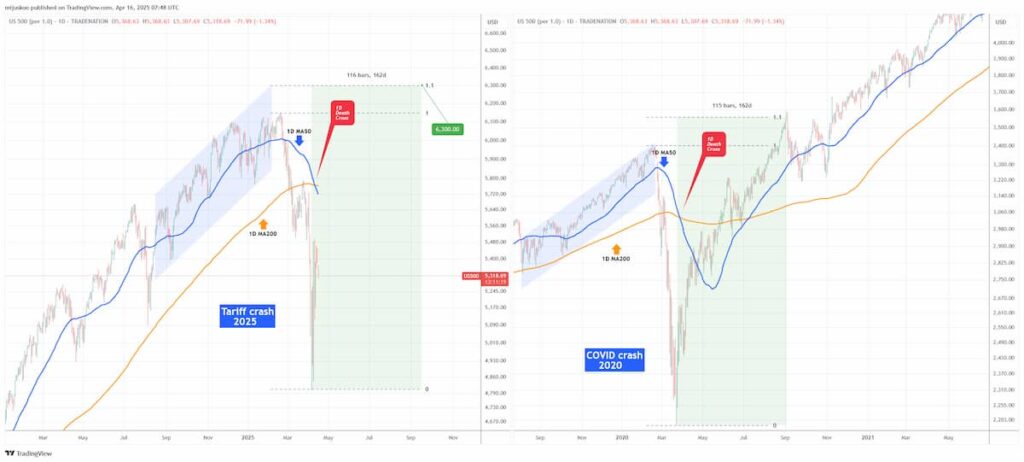
To be more precise, the index reached the 1.1 Fibonacci retracement level in a little over five months. If the same pattern unfolds now, the S&P 500 could surge to 6,300 by mid-September.
With that being said, major Wall Street firms have cut their forecast for the index in 2025 by an average of 16.4% — and with the unpredictability of the White House’s foreign policy, disruptions are to be expected going forward.
Featured image via Shutterstock