As the S&P 500 continues to dazzle the stock market with record gains, a new trend is emerging on the index, signaling worrying times ahead.
Particularly, data shared by financial news aggregator Zerohedge in an X post on July 3 indicated that the S&P 500’s rally appears to be struggling to broaden.
The platform noted that the index’s equally weighted benchmark relative ratio is plummeting to its lowest level since the 2008 financial crisis. The last time the market was this lopsided, Lehman Brothers filed for bankruptcy, triggering a global financial meltdown.
The equally weighted benchmark relative ratio experienced notable peaks around 2014-2015 and again in 2018-2019. However, these were followed by steep declines, particularly during the onset of the COVID-19 pandemic in 2020.
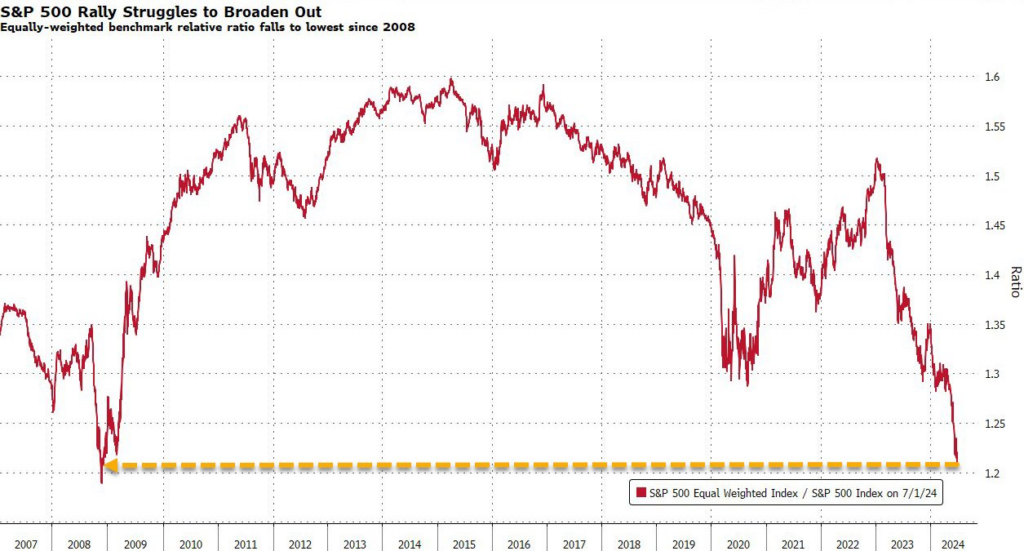
Despite a brief recovery in 2020-2021, the ratio has been on a persistent downward trend, reaching new lows in 2023 and 2024. This suggests a narrowing market rally, where gains are concentrated in fewer stocks rather than broadly distributed across the index.
As of July 1, 2024, the ratio stood at approximately 1.2, contrasting with its peak of around 1.55 in 2014.
Implication of S&P 500 lopsided
Notably, when the market is this lopsided, it indicates that a handful of stocks drive the index’s performance while the majority lag behind. This can create a fragile market environment, susceptible to sharp corrections if those leading stocks falter.
Indeed, this trend has been prevalent in recent months as the index’s rally has been mainly dominated by tech stocks venturing into artificial intelligence (AI), led by Nvidia (NASDAQ: NVDA). Notably, several analysts have issued warnings that the index might experience a crash in the near future.
For instance, as reported by Finbold, banking giant Piper Sandler warned that the summer of 2024 could feature a potential 10% correction for the S&P 500. The entity noted that a potential crash could emanate from warning signs such as a lack of breadth and a slowdown in momentum.
At the same time, the S&P 500 index’s performance has also shown similarities with other periods of economic turmoil. A June 16 Finbold report noted that only 30% of S&P 500 stocks have outperformed the index year-to-date. This performance was also observed during the 2000 Dot-com bubble.
Meanwhile, the S&P 500 index posted a record high, closing the last trading session at 5,537 points.
Disclaimer: The content on this site should not be considered investment advice. Investing is speculative. When investing, your capital is at risk.